Objectives
- Explain the principles and use of titration in laboratory analysis.
- Experimentally determine the molarity of an unknown solution.
- Calculate pH of acids, bases, and buffer solutions.
- Construct acid/base titration curves.
- Explain the purpose of an indicator.
- Draw conclusions from experimental data.
- Conduct laboratory work in compliance with guidelines for personal lab safety and responsible management of chemical waste; this includes appropriate use of personal protective equipment and interpretation of Globally Harmonized System for Hazard Communication (GHS) labels.
- Measure quantities such as mass, volume, temperature, and absorbance with proper technique, and record the results of measurements with the appropriate number of significant figures and units.
- Record observations of chemical processes (such as precipitate formation, gas evolution, etc.) and write chemical reactions consistent with their observations.
- Demonstrate proper techniques for laboratory procedures, such as titration, filtration, solution preparation, spectrophotometric measurements, etc.
- Demonstrate proper use of glassware and equipment, including beakers, Erlenmeyer flasks, volumetric pipets, burets, volumetric flasks, watch glasses, graduated cylinders, filtration apparatus, single-beam spectrophotometer, pH meter, balances.
- Communicate lab procedures, observations, and results in a laboratory notebook, written reports, and verbal presentations effectively.
- Interpret and analyze qualitative observations and quantitative results, incorporating graphs and tables as appropriate.
Introduction
Before lab this week, read the information on titration, acid-base reactions, and pH provided in your textbook. This background information will help you complete this lab.
Titration is a quantitative method for determining the concentration of an unknown solution using a solution of known concentration, or a standard solution. Titration is only effective for reactions that have a 100% yield. Titrations are classified by the type of reaction that occurs. Examples of titration reactions include acid-base titrations, redox titrations, combination reaction titrations, and back titrations. This experiment will focus on acid-base titrations.
Acid-base titrations are based on the neutralization reaction between the analyte and an acidic or basic titrant. These most commonly use a pH indicator, a pH meter, or a conductance meter to determine the endpoint.
In an acid-base titration, the reaction is complete when the acid or base is neutralized. First, an indicator is added to the acid solution. The base solution is then added using a burette until the neutralization reaction has reached its endpoint. At the titration endpoint, the quantity of reactant in the titrant added during the titration is stoichiometrically equivalent to the amount of reactant in the analyte. The concentration of the unknown solution can then be determined using the molarity and volume of the standard solution. Figure 1.0 provides a road map illustrating the general process for the calculations associated with titration.
Figure 1.0 – How to calculate the concentration of an unknown solution.
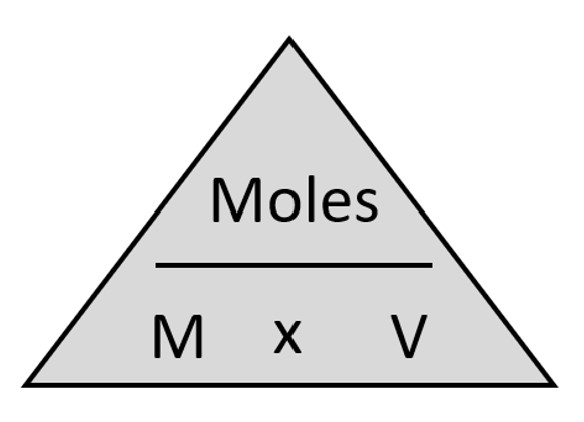
Figure 2.0 – Molarity formula
You will also need to use the molarity formula to convert molarity to moles and vice versa. Figure 2.0 provides this formula.
A suitable indicator must be chosen for the neutralization reaction performed. When all the products have reacted, the reaction endpoint is pH-dependent on the relative strengths of the acids and bases. The pH of the endpoint can be roughly determined using the following rules:
- A strong acid reacts with a strong base to form a neutral (pH=7) solution.
- A strong acid reacts with a weak base to form an acidic (pH<7) solution.
- A weak acid reacts with a strong base to form a basic (pH>7) solution.
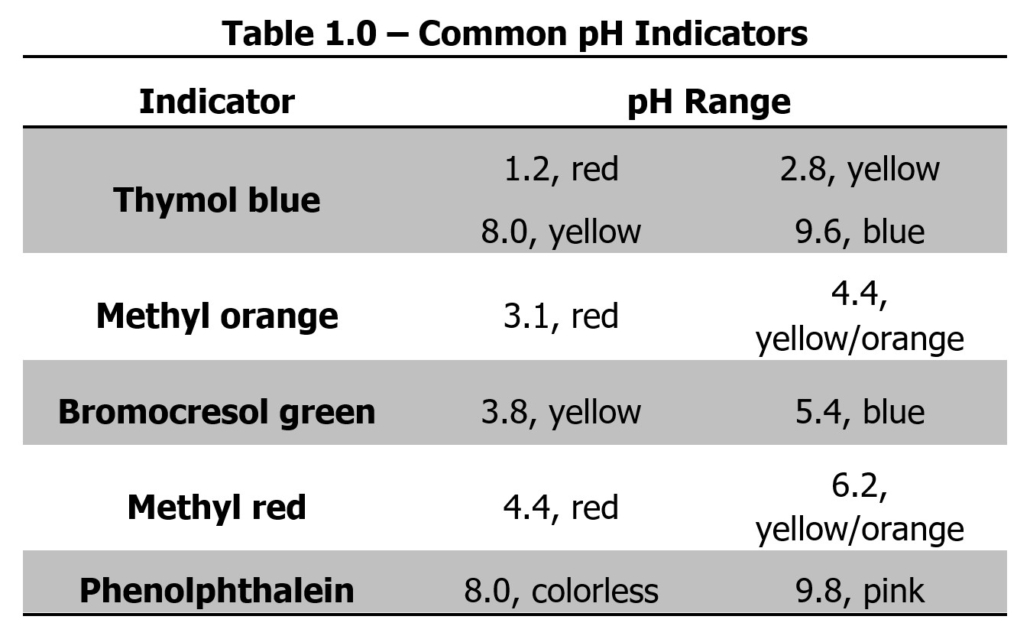
Indicators are generally very complex organic molecules that contain a chromophore. The structure of the chromophore changes slightly when the pH of the reaction changes. The chromophore will have one structure at one range of pH values and a second structure at a second range of pH values. When the structure changes in response to the pH of the solution, the color of the chromophore also changes. Below is a list of some common indicators and the pH at which they react are provided in Table 1.0.
The standard solution for this lab uses oxalic acid, H2C2O4·2H2O, a diprotic acid. Diprotic acids have two hydrogens available for donation in a neutralization reaction. Phenolphthalein, which turns pink at a pH greater than 8.0, will be utilized as the indicator to determine the reaction’s endpoint. Since the endpoint for the reaction of weak acids, such as oxalic acid, with strong bases, such as sodium hydroxide, is greater than pH 7, phenolphthalein is an ideal indicator for titrating this reaction.
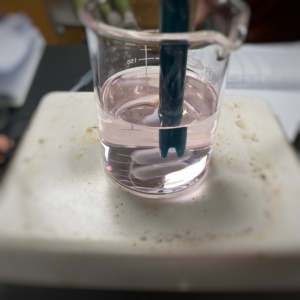
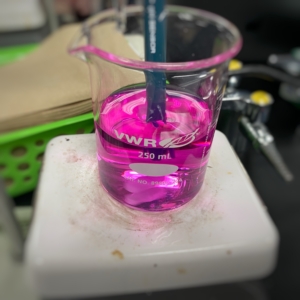
The phenolphthalein will be a very faint pink at the endpoint (see Figure 3.0.) If the phenolphthalein turns a dark pink (see Figure 4.0), you have over-titrated the solution. Be careful to get as faint a pink as you can during your titration.
Note: This lab will be assessed on technique and accuracy and precision in determining the concentration of the unknown acid and base solutions. Take your time, and be sure to record all data correctly.
Figure 3.0 — An example of the faint pink color of phenolphthalein will turn, indicating the endpoint of the titration.
Figure 4.0 — An example of the dark pink color observed when a sample is over-titrated.
Creating a Data Table
You must create a data(s) table for this lab. I recommend you set them up before coming to the lab as it will make your experiment go easier and keep your data neatly organized.
When designing your data table, consider what you measure in the lab. You need to create space to record that data in your table. Also, consider any data you need to calculate during the lab. For example, it may be helpful to include space in your data tables to include the answers to calculations you will complete. This will simplify your post-lab calculations because you can do some simple steps during the experiment and organize the data in the table so it is easy to find later.
Consider also what you ultimately need to find the values necessary to graph the data for this experiment. For example, what are we graphing in this lab? What data do you need to gather to graph this information? You may want to create space in your data table to include the answers to these calculations to help organize your results and make it easier to graph the values.
Video 1.0 – How to design a data table for collecting experimental data.
Safety Information
The safety data sheets for each chemical we will use in this week’s lab are linked below. I encourage you to review these before coming to lab.
- Sodium hydroxide is a strong base. It is corrosive and dangerous to the eyes and skin. Wear your goggles at all times and wash any skin that comes in contact with sodium hydroxide immediately.
- Oxalic Acid dihydrate is a weak acid. Do not allow contact with skin or eyes. Do not ingest or inhale. Wear your goggles at all times and wash any skin that comes in contact with oxalic acid dihydride immediately.
- Phenolphthalein is an eye irritant, flammable, and may cause cancer, or damage fertility/unborn children. Wear your goggles at all times and wash any skin that comes in contact with phenolphthalein immediately.
Nitrile gloves and chemical aprons are available for student use in the chemistry lab. Wear your goggles throughout this lab.
Prelab Lecture Video
Click on the image to the right to watch the pre-lab lecture video for this experiment. The information in this video will help you come to the lab prepared to complete this experiment.
Video 2.0 – Pre-lab lecture video. Click on the image above to view the video. It will open in a new window.
Pre Lab Assignment
Answer the questions below before the start of the lab. They are due to the assignment folder on your teacher’s desk before the beginning of the lab. Failure to complete these questions before the start of the lab will result in a zero for this experiment. (10 points)
- Estimate the pH of the endpoint based on the type of acid/base we are using in this experiment. (1 point)
- Write the balanced equation for the neutralization reaction conducted in this experiment. Include this information in the introduction of your lab notebook. (4 points)
- How many milliliters of a 0.200M NaOH solution are needed to neutralize 125mL of a 0.475M solution of arsenic acid, H3AsO4? You must show all of your work on this problem to receive credit. (5 points)
Experimental Procedure
Experimental Materials
50mL Burette
100mL Volumetric Flask with Stopper (from the cabinet)
Five 250mL Beakers (from the cabinet)
Funnel
Two 100 or 150-mL Beakers
Burette Clamp
Ring Stand
Test Tube Clamp
Oxalic Acid
Phenolphthalein Indicator
Sodium Hydroxide Solution of Unknown Concentration
Vernier Interface with pH probe
Label Tape
Sharpe
DI Water
100mL Graduated Cylinder
Computer with Excel
Printer
Hot plate and stir bar
PART A: Preparation of Standard Solution Using Oxalic Acid
- First, we will prepare a solution of oxalic acid. This will be our standard. Quantitatively transfer approximately 4.0g of oxalic acid to the volumetric flask. Record the mass of the oxalic acid to the nearest milligram in your lab notebook.
NOTE: Information on performing a quantitative transfer is present in Video 1.0. watch this video and add these steps to the procedure in your lab notebook. Be sure to reference the source from which you obtained this information in your notebook (check the references at the end of this lab for this information).
Video 1.0 – How to conduct a quantitative transfer.
- Fill the volumetric flask with DI water until half full and swirl to dissolve the oxalic acid completely.
- Fill the volumetric flask to line with deionized water and gently mix by inverting several times, being sure to hold onto the glass stopper.
- Calculate the molarity of the oxalic acid solution in your notebook. Do this before continuing to Part B.
PART B: Preparing the Burettes
- Wash both burettes with deionized water.
- Rinse one burette with 4-8mL of the oxalic acid solution and drain it through the stopcock into an Erlenmeyer labeled “waste.” Place the burette in the burette clamp and label it “acid.”
Notes: Do not pour the acid and base solutions directly from the stock bottles into the burettes. Transfer the approximate amount you need first to a beaker and then add it to the burette using a funnel.
Be sure to place any acid or base used to “wash” the burette in the appropriate waste container.
- Rinse the other burette with 4-8mL of the sodium hydroxide solution of unknown concentration and drain it through the stopcock into the Erlenmeyer labeled “waste.” Place the burette in the burette clamp and label it “base.”
- Add 45-50mL of the oxalic acid solution to the “acid” burette and 45-50mL of the “unknown” sodium hydroxide solution to the “base” burette. Allow a few drops of each solution to pass through the tip of the burette to ensure it is filled. Make sure there are no air bubbles in the burette or the tip.
- Wait a couple of minutes and record the position of the meniscus in each burette in your lab notebook.
PART C: Titration of the Sodium Hydroxide Solution
Before beginning work on this section, read the pH Sensor User Manual for the Vernier pH probe. This will provide you with basic information on how to use this equipment. Video 2.0 also walks you through how to use this equipment. Rinse the probe with DI water between each solution.
NOTE: You only need to record data for the titration curve during your first trial. You will not record titration curve data using the pH mater in trials 2 and 3.
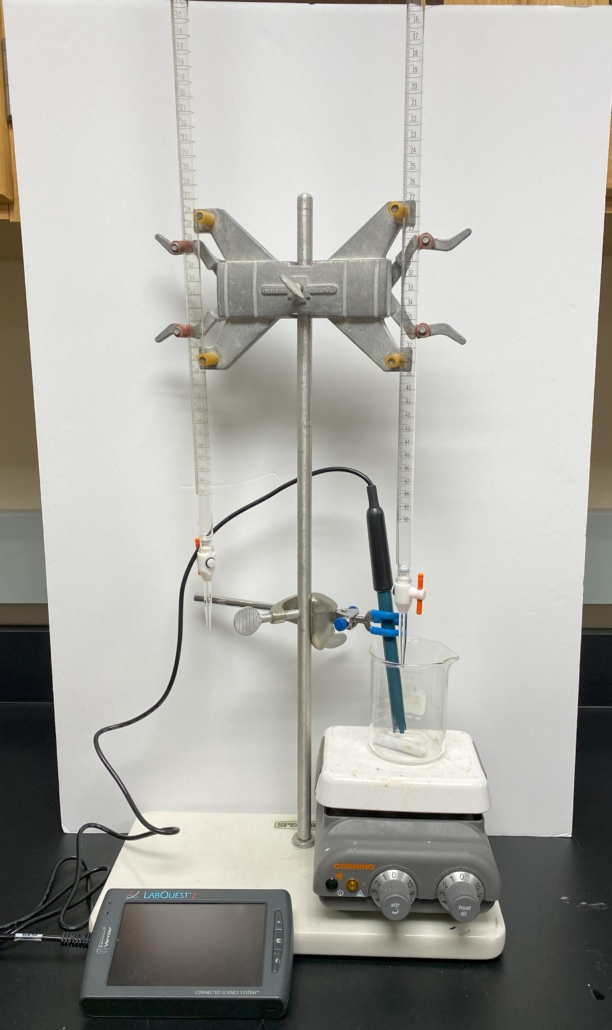
- Set up the glassware and equipment for titration as illustrated in Figure 3.0.
- Place 25-30mL of the oxalic acid solution from the burette into a 250mL beaker. Wait a few minutes for the acid solution to drain from the sides of the burette and then record the volume of acid used in your lab notebook.
- Place at least 100mL of deionized water in the beaker with the oxalic acid. The amount of water you add doesn’t matter as long as enough total solution is present for the pH meter to be submerged in the beaker, allowing room for the stir bar to move. Add 2-3 drops of phenolphthalein to the acid solution. Place a stir bar in the beaker. Place the beaker on the stir plate. Turn on the stir plate so the solution mixes vigorously but not splashing.
- Add the pH meter to the flask, clamping it in place. The pH meter should be below the solution’s surface but not touching the bottom of the beaker or being hit by the stir bar. If you need more solution, add more DI water to the beaker. Record the starting pH in your lab notebook.
- Begin titrating slowly by adding the sodium hydroxide solution to the Erlenmeyer containing the oxalic acid solution. Pause the titration every approximately 0.5mL or 10 drops and record the volume of NaOH added and pH in your lab notebook.
- As the reaction nears its end, the pink color from the phenolphthalein will linger longer. Begin adding the base solution dropwise until the faint pink color does not fade in a 15-second period.
- If you add too much base (the solution turns a dark pink), add a few more mL of the acid solution, accounting for this addition in your lab notebook, and continue the titration again until the solution turns a faint pink.
- Once the acid has titrated (the faint pink color does not fade in a 15 second period), record the amount of the sodium hydroxide solution transferred from the burette and the final pH of the solution in your lab notebook.
- Repeat steps 1 through 6 (without using the pH meter) and record the results in your lab notebook as “Trial 2 and Trial 3.” Average the concentrations for the base solution.
Video 2.0 (above) – How to use the Vernier interface and pH probe.
Figure 3.0 (below) – Titration equipment setup. Be careful not to allow the stir bar to hit the pH meter, as it will damage/destroy the meter.
PART D: Creation of a Titration Curve
- Open Excel on your laptop or use the computer in front of the classroom.
- Titration curves are graphed pH vs. volume. Input your data into the table, putting the mL or drops of acid added in column A and the pH in column B.
- Graph your data for Trial 1 using Excel. Title your graph and label the axis with the data measured and units. Email your instructor the Excel file with your graph and ask her to print it.
- Glue your graphs in your lab notebook.
Waste Disposal
- Pour all acid and base solutions together into one beaker. All neutralized acid-base solutions can be disposed of down the drain with plenty of water.
- Place any glassware you took from the cabinets in the container on your teacher’s desk.
- Return the magnetic stir bars to the table in the front of the room.
- Wash any other equipment used with soap and DI water (the final rinse being with DI water) before putting it away.
Post Lab Assignment
Items To Include In Your Lab Notebook:
Once you have completed this experiment and recorded all of your data in your laboratory notebook:
- Write the discussion and conclusions sections for the lab. The questions in the post-lab assignment will help you process the data from this lab. Be sure to include all of the calculations from the post-lab assignment in your lab manual.
- Include a printed copy of the graph you create in the post-lab in your lab notebook.
- Include all calculations for determining the concentration of these three solutions. Ensure everything is neat and easy to follow. Please circle and label the final calculated concentration for each solution.
- Calculate the pH endpoint of the reaction for each trial.
- Construct a titration curve for Trail 1 using Excel. Title the graph and label the axis (complete with units). Print and glue the graph in your lab notebook.
- Complete the post-lab assignment and submit it to your instructor.
Acid-Base Titration Post-Lab Assignment (15 points)
Using the information you gathered during today’s lab, answer the following questions. This assignment is due at the start of the next lab period.
- Calculate the pH of the endpoint for each trial. Include your calculations for 1 of the trials. You can simply write your answers for the other two trials on this assignment. (5 points)
- Calculate the concentration of NaOH for each trial. Include your calculations for 1 of the trials below. You can write your answers for the other two trials on this assignment. (5 points)
- What is the average concentration you determined for the sodium hydroxide solution? (1 point)
- Using your average concentration for NaOH, calculate the percent error for the concentration of NaOH you experimentally determined in this lab. (2 points)
- What are two errors you encountered during this lab? How could they have impacted your results? (2 points)
References
ScienceGonnaGetYou. (2015, October 14). How to Make a Data Table [Video]. YouTube. https://youtu.be/vatJYQEV-qA
TruChemOnline. (2014, September 4). TRU Chemistry Labs: How To Do Quantitative Transfer [Video]. YouTube. https://youtu.be/0zRs6rCqIts
Sigma Aldrich. “phenolphathalein.” Datasheet, [Revised Feb, 2023]. https://www.sigmaaldrich.com/US/en/sds/sial/p9750?srsltid=AfmBOookN8_uhnGp48NZSqyeKx1B8mWZImqWQ_kBY1cCdIoXYN7WRiFc
Sigma Aldrich. “sodium hydroxide” Datasheet, [Revised Dec. 2024]. https://www.sigmaaldrich.com/IN/en/sds/sigald/s8045?srsltid=AfmBOorFbXne_pdxlidK33OAtPwOIrTmU1UBcidWo3Bd41XeUs9NR5rD
Thermo Fisher Scientific. “oxalic acid dihydrate.” Datasheet, Oct. 2009. [Revised Oct. 2023]. https://www.fishersci.com/store/msds?partNumber=A219500&productDescription=OXALIC+ACID+CERTIF+ACS+500G&vendorId=VN00033897&countryCode=US&language=en
Vernier Science Education. (2012, June 25). pH Sensor – Tech Tips with Vernier [Video]. YouTube. https://youtu.be/gFRHIb0wDLI?si=rS0oe0X3KuSn3WzN
Vernier Science Education. (2024). pH Sensor. Vernier Science Education. https://www.vernier.com/files/manuals/ph-bta/ph-bta.pdf
This page was published on February 29, 2024 and last updated on March 31, 2025.
©Catherine Haslag 2025. All Rights Reserved.


