ObjectivesIntroductionPre Lab AssignmentExperimental ProcedurePost Lab AssignmentLab ReportReferences
Objectives
- Conduct laboratory work in compliance with guidelines for personal lab safety and responsible management of chemical waste; this includes appropriate use of personal protective equipment and interpretation of Globally Harmonized System for Hazard Communication (GHS) labels.
- Measure quantities such as mass, volume, temperature, and absorbance with proper technique, and record the results of measurements with the appropriate number of significant figures and units.
- Record observations of chemical processes (such as precipitate formation, gas evolution, etc.) and write chemical reactions consistent with their observations.
- Demonstrate proper techniques for laboratory procedures, such as titration, filtration, solution preparation, spectrophotometric measurements, etc.
- Demonstrate proper use of glassware and equipment, including beakers, Erlenmeyer flasks, volumetric pipets, burets, volumetric flasks, watch glasses, graduated cylinders, filtration apparatus, single-beam spectrophotometer, pH meter, balances.
- Communicate lab procedures, observations, and results in a laboratory notebook, written reports, and verbal presentations effectively.
- Interpret and analyze qualitative observations and quantitative results, incorporating graphs and tables as appropriate.
- Perform volumetric dilutions.
- Experimentally determine the absorbance of a solution.
- Utilize Beer’s Law to determine the concentration of a solution.
- Read scientific journal articles.
- Identify errors and explain their effect on experimental data.
Introduction
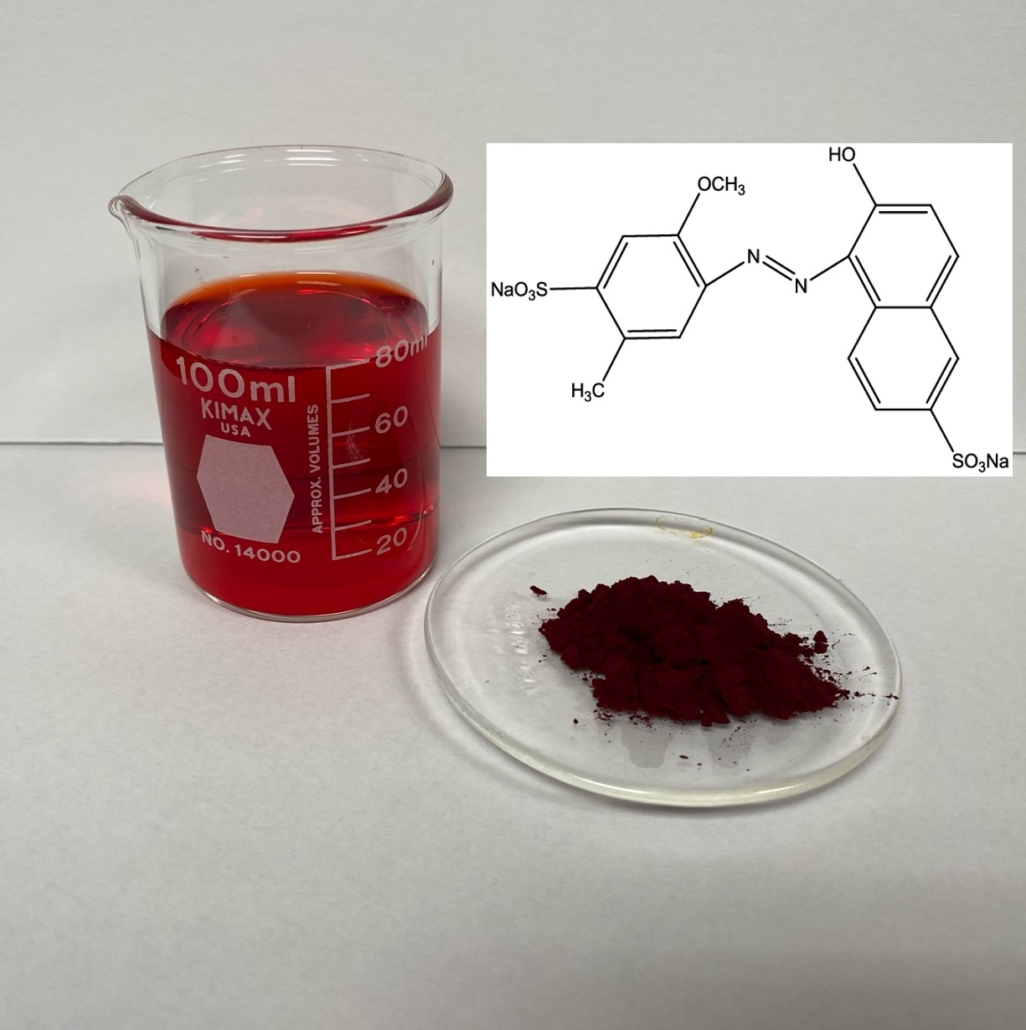
Also known as Red Dye 40, Allura Red is used in many foods and medicines. To determine if this is used in something you consume, check the ingredients label on the back of the product. Figure 1 shows the structure of Allura Red.
Serial Dilutions
We will make serial dilutions in this lab using volumetric pipettes and flasks.
A serial dilution involves taking a known amount of a solution, adding that amount to a volumetric flask, and diluting the solution to a new volume. Then, you take an amount of that new solution and dilute it again to make another, more dilute new solution. This continues until you have made a series of dilutions, always taking from the previous solution to make the new, more dilute solution. If you make a mistake, you must go back and restart the series. You must be careful when making these dilutions. Do not fill past the line on the volumetric flask, as this will create an error with your concentration. Be careful to remove the correct about using the volumetric pipette. These solutions must be made as accurately as possible so your data can create a reliable Beer’s Law Plot. You must remake every solution if you make a mistake while performing serial dilutions.
Figure 1.0 – Structure and appearance (solid and in aqueous solution) of Allura Red.
We will use pipettes this week. Videos 1.0 and 2.0 below demonstrate how to use volumetric and graduated pipettes using pipettors. These videos show different ways to use pipettes. You need to watch them both. Before beginning your serial dilutions, practice using the volumetric pipette with a beaker of water until you feel comfortable using this equipment.
Video 1.0 – How to use a volumetric pipette using a pipette bulb.
Video 2.0 – How to use a graduated and volumetric pipette.
Absorbance
Absorbance measures how much light at a specific wavelength a solution absorbs. Absorbance is a unitless value and is measured using a spectrophotometer. A sample (aliquot) of the solution is placed in a cuvette, a clear glass or plastic container designed for use in a spectrophotometer. A beam of light set to a specific wavelength is passed through the sample, and the sample’s absorbance is measured. As the concentration of the solution increases, so will the absorbance.
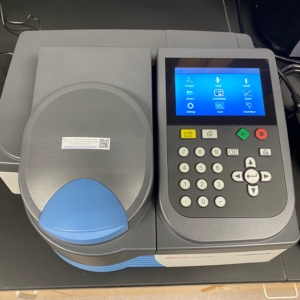
We will use a Genesys 30 spectrophotometer (Figure 2.0) for this lab. The Genesys 30 Spectrophotometer user guide provided by Thermo Fisher Scientific explains how to use this equipment in Live Display. Please review pages 8-10 of this manual for instructions on how to collect absorbance during this experiment. You will want to include these instructions in your lab manual. It is ok to print these pages and paste them into your lab manual.
Absorbance values between 0.1 and 1 are ideal. Absorbance values greater than 1 indicate that your solution is too concentrated and should be diluted.
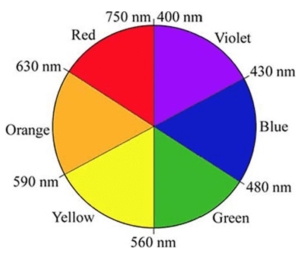
When absorbance is measured, we look for the wavelength of the complementary color absorbed. For example, if something appears blue to our eye, blue light is reflected back to us, and the complementary color is absorbed. A color wheel is used to identify the complementary color that is absorbed. Figure 3.0 provides a color wheel and the wavelengths for each associated color.
Figure 2.0 – The Genesys 30 spectrophotometer (above).
Figure 3.0 – Color wheel and wavelengths (below).
Beer’s Law
Beer’s Law relates concentration to absorbance according to the following formula:
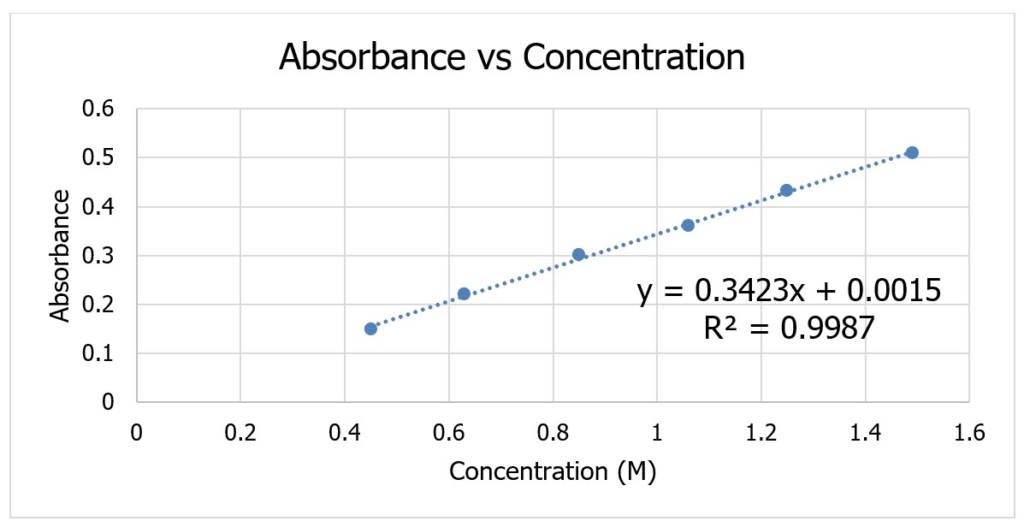
To utilize Beer’s Law, it is necessary to create a Beer’s Law Plot (calibration curve) using solutions of known concentration. This plot is made by measuring the absorbance of several solutions of known concentration and graphing the data using absorbance vs. concentration. An example of a Beer’s Law Plot is provided below in Figure 4.0. Video 3.0 demonstrates how to create a Beer’s Law Plot using Excel.
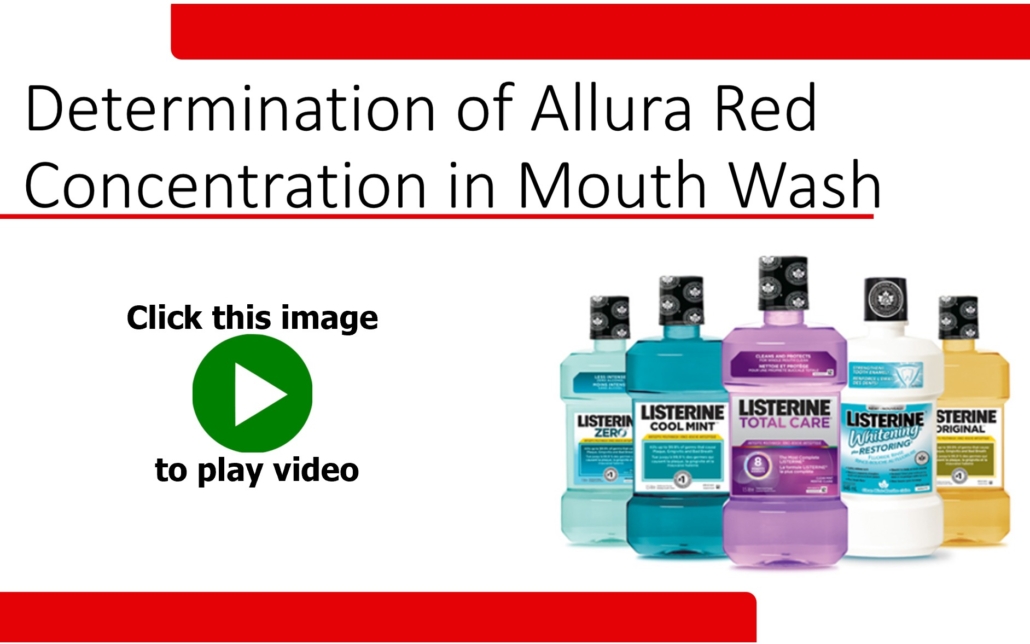
Video 3.0 – How to Create a Beer’s Law Plot in Excel. Click on the image above to view this video.
Figure 4.0 – An example of a Beer’s Law Plot.
The R2 value measures the accuracy and precision of your data. The closer the R2 value is to 1, the better your data.
The equation for the line provided is in the format y=mx+b. This equation can be used to determine the concentration of the solution because it gives you the values for the formula A=abc, where:
- y is the Absorbance (A)
- m (slope) is ab
- x is the concentration of the solution
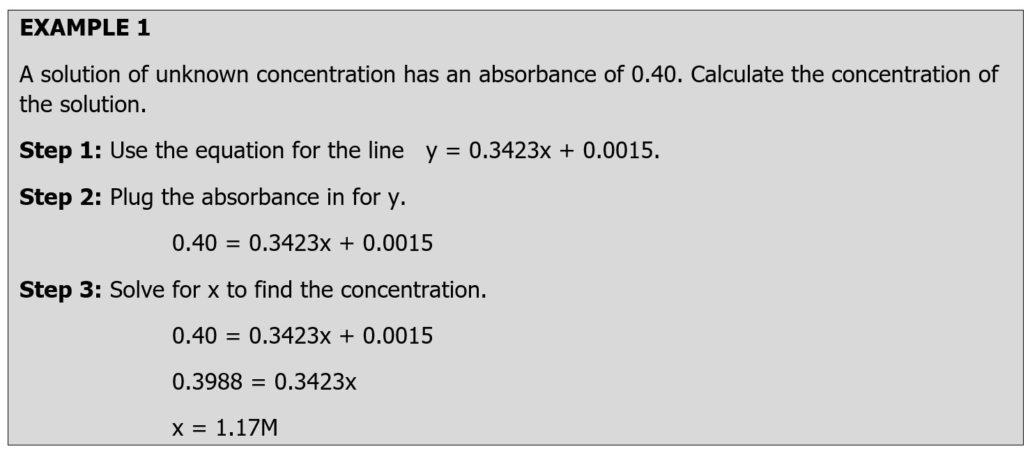
Once you know the absorbance for the solution, you need to plug in the absorbance for y the line and solve for x (the concentration). Example 1 demonstrates how the equation for the line above is used to determine the concentration of a solution.
This experiment will determine the absorbance of several solutions using a spectrophotometer. We will then create a Beer’s Law Plot (absorbance vs. concentration) and use the equation from the line to determine the concentration of Allura Red in a mouthwash sample. If you have a laptop, please bring it to lab this week. Each group must graph their Beer’s Law Plot before leaving class. Once you and your lab partner have graphed your data, email a copy of your graph to your instructor. I will print copies for you to include in your lab notebook.
Creating Data Tables
You will need to create one or more data tables for this lab. I recommend you set it/them up before coming to the lab as it will make your experiment go easier and keep your data neatly organized. If you prefer to create your data table as you complete your experiment, you are welcome to do that, but remember to keep it neat and organized so others can clearly and easily read and follow your data.
When designing your data table, consider what you measure in the lab. You need to create space to record that data in your table. We will also be calculating concentration in the lab. Create a column in your table that includes this calculated data with the other data you will collect in the lab.
Safety Information
Allura Red is not a hazardous chemical. It will stain your skin and clothes, so I do not recommend wearing your favorite outfit in this week’s lab. Please review the safety data sheet for this chemical for more safety information.
Nitrile gloves and chemical aprons are available for student use in the chemistry lab. Wear your goggles throughout this lab.
Pre Lab Lecture Video
To the right is the pre-lab lecture video for this experiment. Please click on the image to watch the video. This video will open in Media Space in a new browser window.
Video 4.0 – Pre-lab lecture video. Click on the image above to view the video. It will open in a new window.
Pre Lab Assignment
Answer the questions below before the start of the lab. They are due at the teacher’s desk before the start of the lab. Failure to complete these questions before the start of the lab will result in a zero for this experiment. (25 points)
1. What light will it absorb if Allura Red reflects light in the red spectrum? What range of wavelengths does this color of light absorb? (4 points).
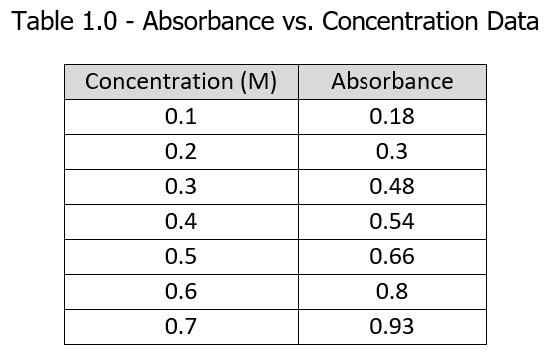
2. Create a Beer’s Law Plot (absorbance vs. concentration) using Excel for the below data. If the absorbance for a sample of this solution is 0.60, what is the concentration of the solution? Staple a copy of your Beer’s Law Plot to this paper. Title the graph, label the axes, and include the equation for the line and R2 Note if you threw out any of the data points and why. Show all of your calculations for this problem. (10 points)
3. A 0.125M solution is used to produce 250mL of a 0.075M solution. What volume of the 0.125M solution is needed to create this new 0.075M solution? (2 points)
4. Why is it important not to fill above the line on the volumetric flask when creating a solution? (2 points)
5. Using the journal article, The color of controversy: Link between food dyes, childhood hyperactivity gets renewed attention, what are some concerns about using Allura Red in food? (2 points)
6. What type of article is The color of controversy: Link between food dyes, childhood hyperactivity gets renewed attention? Explain your reasoning. (2 points).
7. Do you think The color of controversy: Link between food dyes, childhood hyperactivity gets renewed attention is a reliable source? Give at least 3 pieces of evidence to support your reasoning. Please refer to the Reliable Sources and How to Read a Scientific Article information from General Chemistry I if you need a refresher on determining if a source is reliable. (3 points).
Experimental Procedure
Experimental Materials
Stock solution of Allura Red
Genesys 30 Spectrophotometer
Seven 50mL volumetric flasks (from the cabinet)
Six 50mL beakers (from the cabinet)
25mL volumetric pipet and bulb
Disposable plastic pipets
Two Cuvettes
Kim Wipes
Computer with Excel
Printer
Label Tape
Sharpe
DI Water
NOTE: Use Kim Wipes to clean the sides of the cuvette before placing it in the chamber of the spectrophotometer. This will remove any fingerprints or liquids from the side of the container. These can cause errors in your results. Always place the cuvette in the chamber in the same direction throughout the experiment to limit errors.
Rinse the cuvette with DI water and shake it out into the sink between Allura Red solutions.
Label all of the containers in this lab with the concentration of the solution.
Part A: Determining Maximum Wavelength for Absorption
- Use a ruler to measure the inner diameter of the cuvette to the nearest 0.01cm. Record this information in your lab notebook.
- Obtain approximately 40mL of Allura Red from the stock bottle on the table in the front of the classroom. Record the concentration of the solution in your lab notebook.
- Fill a cuvette approximately 2/3 full of the stock solution.
- Fill a cuvette approximately 2/3 with DI water. This will be your blank sample throughout this experiment. You want to “blank” the spectrophotometer every time you change the wavelength. Your instructor will show you how to do this at the start of class. These instructions will not tell you to “blank” the spectrophotometer between changes in wavelength. However, you need to remember to do this.
- Set the spectrophotometer to the lowest wavelength for the color range that compliments red. Place the cuvette with Allura Red solution in the chamber. Record the absorbance and wavelength in your lab notebook. Repeat this procedure, changing the wavelength 10nm each time. Don’t forget to “blank” the spectrophotometer between each sample.
NOTE: The absorbance of your sample should not exceed one. If it does, talk to your instructor.
- The absorbance of your sample should increase as you change the wavelength. However, you will notice the absorbance decreases when you change the wavelength at some point. This means you have identified a window for where the highest absorbance for the sample is. Once you have this 10nm window, test your sample for each wavelength in that window until you find the highest absorbance. Record the absorbance and wavelength in your lab notebook. Once you have identified the highest wavelength, check with your instructor to ensure you have identified the correct wavelength. Once you have found this wavelength with the highest absorbance, you will test all future samples using this wavelength.
Part B: Measuring Absorbance of Known Concentrations of Allura Red
- You will need to complete a series of dilutions to create a total of 4 solutions of Allura Red. The blank sample (absorbance = 0) and the max absorbance you measured in Part A, Step 5 are your first two data points. Next, you will create four more solutions using the stock solution and obtain the absorbance of these four solutions.
- Using the volumetric pipet, remove a 25mL aliquot (sample) of the stock solution from the beaker and place it in a 50mL volumetric flask. Add water to the line and carefully mix the solution by capping the flask with a stopper and inverting it, keeping your thumb on the stopper to hold it in place. Pour this solution in a clean, dry, labeled beaker. Rinse the volumetric pipet with DI Water and use the bulb to blow the remaining liquid out of the pipet.
- Using the volumetric pipet, remove a 25mL aliquot of the new solution from the beaker and place it in a 50mL volumetric flask. Add water to the line and carefully mix the solution by capping the flask with a stopper and inverting it, keeping your thumb on the stopper to hold it in place. Pour this solution in a clean, dry, labeled beaker. Rinse the volumetric pipet with DI Water and use the bulb to blow the remaining liquid out of the pipet.
- Repeat Step 3 two more times until you have made a total of four solutions of Allura Red.
- Add some of the solution made in Step 2 to the cuvette and measure the absorbance of the sample. Record this information in your lab notebook.
- Repeat Step 5 for each of the other Allura Red samples you created. There should be a total of 6 data points when you are done – the blank, the stock solution, and the four solutions you made from the serial dilution.
Part C: Creating a Beer’s Law Plot
- Use your laptop or the computer in the front of the classroom to create a Beer’s Law Plot for your data. You must determine the new concentration for each of the four solutions you made using the dilution formula. You will want to look this formula up before class and include it in your lab notebook.
- Plot the concentration of your six solutions and their absorbance (absorbance vs. concentration). Then, title your graph, label your axes, and include the equation for the line and R2 value on your graph.
- When you have completed your graph, let your instructor know so she can check your graph and print a copy for you and your partner. Finally, you will need to glue this graph in your lab notebook.
Part D: Determining the Concentration of Allura Red in Mouthwash
- Obtain about 10mL of mouthwash from the table in the front of the classroom. Add this solution to the cuvette and measure its absorbance. Record this information in your lab notebook.
Waste Disposal
- Flush all solutions down the drain with lots of water.
- Place the volumetric flasks and pipets in the container on the instructor’s desk.
- Clean out the cuvettes and place them on the table in the front of the classroom.
- Wash any other equipment used with soap and DI water (the final rinse with DI water) before putting it away.
Post Lab Assignment
Once you have completed this experiment and recorded all of your data in your laboratory notebook:
- Write the discussion and conclusions sections for the lab. The questions in the post-lab assignment will help you process the data from this lab. Include all of the calculations from the post-lab assignment in your lab notebook.
- Include all concentration/dilution calculations in your lab notebook. The formula you need to do this work is in the introduction of this lab.
- Paste a copy of the Beer’s Law Plot you created in Part C in your lab notebook. Your instructor has glue sticks if you need them.
- Calculate the concentration of Allura Red in the mouthwash based on your experimental data. I worked an example problem for this in the prelab lecture video. Start watching at 2:58 to review the background information and example problem demonstrating how to do this work.
There is no post-lab assignment to submit to your instructor the week after this experiment.
I did not post a “Where Do We Go From Here?” video since I already demonstrated how to do this work in the prelab lecture video and introduction.
Lab Report
You will write a formal lab report on the experiment and your results. Please see the Guide for Writing a Formal Lab Report provided in the General Course Materials section of Brightspace. The due date for this assignment is noted on the semester schedule.
Below is some experiment-specific information you will need to include in your report:
- A data table(s) outlining your results/data.
- Sample calculations for determining the solutions’ new concentration and Allura Red’s concentration in the mouthwash.
- Use The color of controversy: Link between food dyes, childhood hyperactivity gets renewed attention article in your introduction to discuss Allura Red, its use, and health factors.
- List your calculated and average concentrations for Allura Red in Mouth wash.
- Include a table reporting class data for the average concentration of Allura Red in mouthwash. Calculate this data’s mean, median, range, and standard deviation.
- Include the Beer’s Law Plot you created in the lab in the formal lab report.
A rubric for this formal lab report can be found on Brightspace if you go to Assignment → Rubrics → Allura Red Formal Lab Report Rubric.
References
Ambridge, C. (2014, August 22). Volumetric Technique 2: Use of a Pipette [Video]. YouTube. https://youtu.be/pCzbvJksehY
Beil. (2011). The color of controversy: Link between food dyes, childhood hyperactivity gets renewed attention. Science News (Washington), 180(5), 22–25. https://doi.org/10.1002/scin.5591800523
Columbia Gorge Community College. (2009, September 21). How to Use a Pipette [Video]. YouTube. https://youtu.be/2WZ6sREzCsc
Department of Chemistry at the University of California, Santa Cruz. (2011). Lab 9 – Determination of Allura Red Concentration in Mouthwash. General Chemistry, First Edition. https://www.webassign.net/labsgraceperiod/ucscgencheml1/lab_9/manual.html
Sharma, McKone, H. T., & Markow, P. G. (2011). A Global Perspective on the History, Use, and Identification of Synthetic Food Dyes. Journal of Chemical Education, 88(1), 24–28. https://doi.org/10.1021/ed100545v
Sigma Aldrich. (2023, December 21). Allura Red AC Safety Data Sheet. Sigma Aldrich. https://www.sigmaaldrich.com/US/en/sds/sial/458848?userType=anonymous
Thermo Fisher Scientific Inc. (2015, March). Genesys 30 Spectrophotometer User Guide. https://knowledge1.thermofisher.com/@api/deki/files/4661/269-317300_-_Rev_A_-_GENESYS_30_Spectrophotometer_User_Guide.pdf?revision=1
This page was published on January 15, 2024 and last updated on February 28, 2025.
©Catherine Haslag 2025. All Rights Reserved.


