Objectives
- Conduct laboratory work in compliance with guidelines for personal lab safety and responsible management of chemical waste; this includes appropriate use of personal protective equipment and interpretation of Globally Harmonized System for Hazard Communication (GHS) labels.
- Measure quantities such as mass, volume, temperature, and absorbance with proper technique, and record the results of measurements with the appropriate number of significant figures and units.
- Record observations of chemical processes (such as precipitate formation, gas evolution, etc.) and write chemical reactions consistent with their observations.
- Demonstrate proper techniques for laboratory procedures, such as titration, filtration, solution preparation, spectrophotometric measurements, etc.
- Demonstrate proper use of glassware and equipment, including beakers, Erlenmeyer flasks, volumetric pipets, burets, volumetric flasks, watch glasses, graduated cylinders, filtration apparatus, single-beam spectrophotometer, pH meter, balances.
- Communicate lab procedures, observations, and results in a laboratory notebook, written reports, and verbal presentations effectively.
- Interpret and analyze qualitative observations and quantitative results, incorporating graphs and tables as appropriate.
- Write equilibrium constant expressions for chemical equations.
- Calculate equilibrium concentrations from initial concentrations and the equilibrium constant.
- Experimentally determine the equilibrium constant for a reaction.
- Draw conclusions from experimental data.
Introduction
Read Chapter 13 of your textbook on chemical equilibria before the start of this lab. It discusses the background information and provides example problems that relate to the calculations we will be doing this week.
This week we will quantitatively assess the equilibrium constant for the reaction of iron (III) cation complexing with a thiocyanate anion (SCN)– to form the iron (III) thiocyanate complex, Fe(SCN)2+ (Equation 1). Write the equilibrium expression for this reaction in the space provided for Equation 2 and include it in the introduction of your lab manual.
If Keq is a large number (>1), then the chemical equilibrium favors the formation of product (large numerator). If Keq is a small number (<1) then the chemical equilibrium favors the formation of reactants (large denominator). In this experiment, several solutions of varying initial concentrations of the reactants are to be prepared. Despite the different concentrations, the equilibrium constants calculated from their equilibrium concentrations should be the same, as long as the temperature is kept constant. Before we begin the study of the equilibrium concentrations, we must first prepare a standard curve, also known as a Beer’s Law Plot, to help us determine the concentration of Fe(SCN)2+ at equilibrium. Le Châtelier’s Principle states that if at equilibrium a change is applied to a system, the species will react to offset the change so as to maintain the equilibrium. We will use this principle to aid in the preparation of the standard curve. It will be made by plotting the absorbance versus concentration of the red iron (III) thiocyanate complex, (Fe(SCN)2+). If the concentration of the reactant, iron (III) nitrate, is increased (0.200 M), so as to become much larger than the thiocyanate anion concentration (0.00200M), then the reaction (Equation 1) will be forced almost completely to products. In this situation, the iron (III) concentration is 100 times that of the thiocyanate, therefore essentially all the SCN–anions will react to produce the red colored product, Fe(SCN)2+. Thus, within the limits of our detection apparatus, the final concentration of Fe(SCN)2+ is equal to the initial concentration of SCN–. The intensity of the red color will be measured spectrophotometrically and will be directly proportional to the equilibrium concentration of the Fe(SCN)2+ species.
After a standard curve is produced, the conditions will be altered so that the concentrations of each of the two reacting species (Fe3+ and SCN–) will be the same order of magnitude (~0.00200 M each). Because the concentrations will be so similar, the system will no longer be forced all the way to the right (towards the products) and you will be able to determine an equilibrium constant from the data. The concentration of Fe(SCN)2+ at equilibrium will be determined spectrophotometrically according to its absorbance in the standard curve. Since for every mole of the red complex, Fe(SCN)2+ produced, one mole of Fe3+ and one mole of SCN– will have reacted, the equilibrium concentrations (unreacted species) of Fe3+ and SCN– can be determined by subtracting the concentration of Fe(SCN)2+ formed from the initial concentrations before the reaction took place. We can set up an “ICE” table, find the equilibrium concentrations for each of the three species, and solve for Keq. We have worked many examples like this in class. Please refer to your notes from class for examples of this process.
Each of the initial solutions will be made up so as to contain 0.500 M H+. Therefore when mixing the solution of 0.00200 M F Fe3+ made up in 0.500 M H+ and the solution of 0.00200 M SCN– made up in 0.500 M H+, no matter what the proportions, the 0.500 M H+ concentration will be constant. The reason for this is that the iron (III) thiocyanate formation reaction must be run around 0.5 M acid to prevent significant iron hydrolysis (Equation 3) that affects the concentration of iron (III) ions. Also, the reaction must be run at acid concentration below 0.7 M because otherwise the acid reacts with the thiocyanate reducing the available SCN– as well (Equation 4).
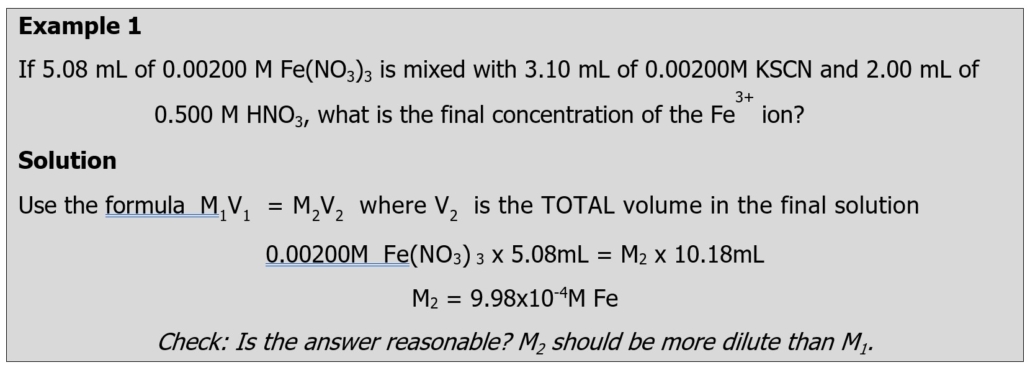
Each reagent is labeled with its concentration. However, once you mix reagents together, you will have diluted the concentration. The calculations that you use will need to account for these dilutions. An example is below:
ICE Table Construction
ICE tables are useful tables that summarize what is occurring in an equilibrium reaction. The use of ICE tables should have been covered in your lecture class. You need to know that “I” stands for initial concentration of each species in the solution, before they are allowed to react. “C” stands for the change in concentration of each species from the initial concentrations to the equilibrium concentrations. And the “E” stands for equilibrium concentration of each species (i.e. concentration after the reaction has reached equilibrium). Below is an example of how the ICE table will be used.
Example 2: Assume an initial concentration of [Fe3+] = 0.00100 M and an initial concentration of [SCN–] = 0.000600 M in a sample solution for which you are to determine the concentration of Fe(SCN)2+ from the standard curve. You can set up an ICE table as shown below:
X = [Fe(SCN)2+] and is to be determined from the standard curve. You can then calculate the equilibrium constant, Keq, using the equilibrium concentrations.
In your ICE tables on the Calculations & Results Page, do not write “X” but use the actual concentration obtained from the standard curve. For example, if X = 0.000211 M, [Fe3+] at equilibrium would be (0.00100 − 0.000211) M = 0.00079 M.
Use of the Standard Curve (Beer’s Law Plot)
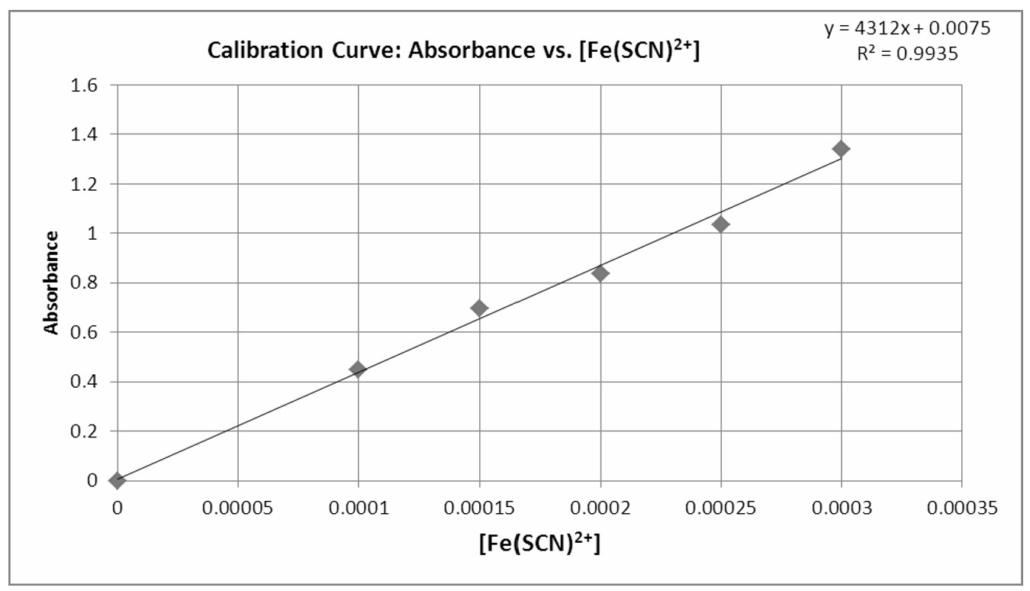
The standard curve is a plot of Absorbance versus [Fe(SCN)2+] (Figure 1). It can be used to give us the concentration of a solution when given the absorbance. We can either read it off the graph visually or calculate the concentration from the trendline equation. Remember that Beer’s Law indicates the relationship between the concentration and the absorbance is linear. Thus A = mC +b where A is the absorbance, m is the slope, C is the concentration and b is the y-intercept. Considering that A has not units and C has units of M, what is the unit of the slope? What is the unit of the y-intercept? You should know the answers.
Figure 1.0 – A Beer’s Law Plot (calibration curve) created using Excel.
Video 1.0 – How to Create a Beer’s Law Plot (calibration curve) in Excel. Click on the image above to view the video. It will open in a new window.
We will use a Genesys 30 spectrophotometer for this lab. This is the same equipment we used in the Allura Red lab. The Genesys 30 Spectrophotometer user guide provided by Thermo Fisher Scientific explains how to use this equipment in Live Display. Please review pages 8-10 of this manual for instructions on how to collect absorbance during this experiment. You will want to include these instructions in your lab manual. It is ok to print these pages and paste them into your lab manual.
We will then create a Beer’s Law Plot (absorbance vs. concentration) and use the equation from the line to determine the concentration of Fe(SCN)2+.
Creating a Data Table
You will need to create many data tables for this lab. I recommend you set it up before coming to the lab as it will make your experiment go easier and keep your data neatly organized.
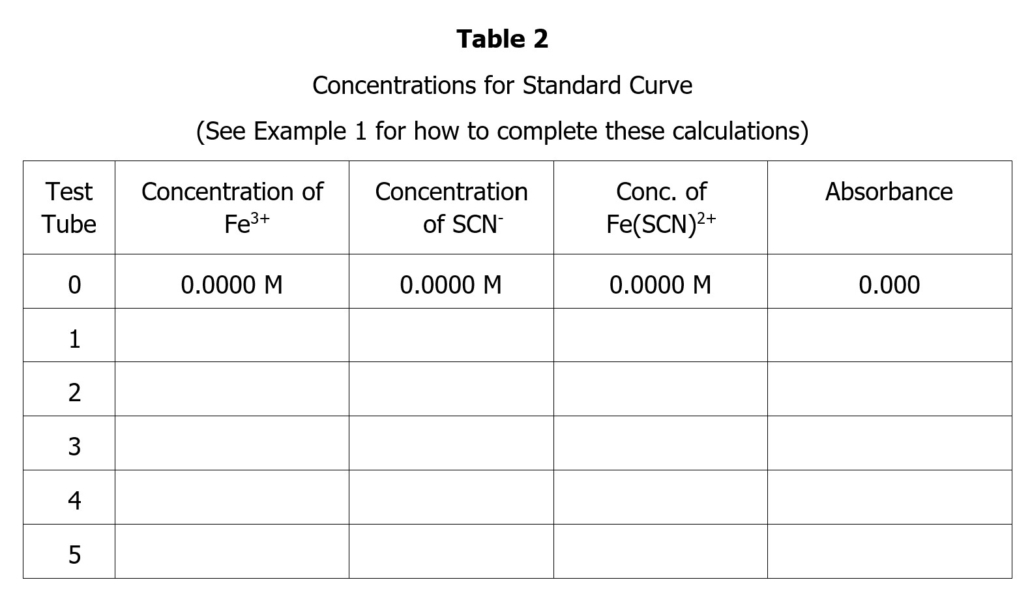
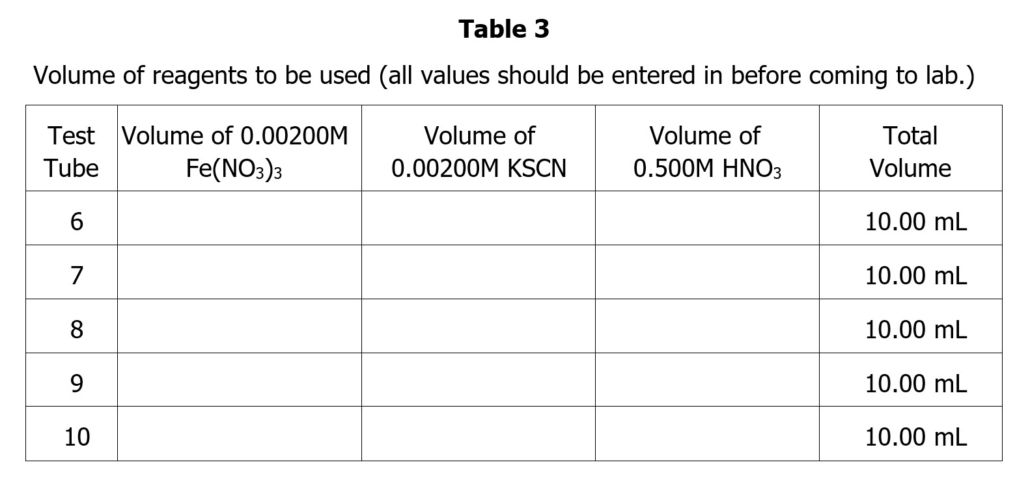
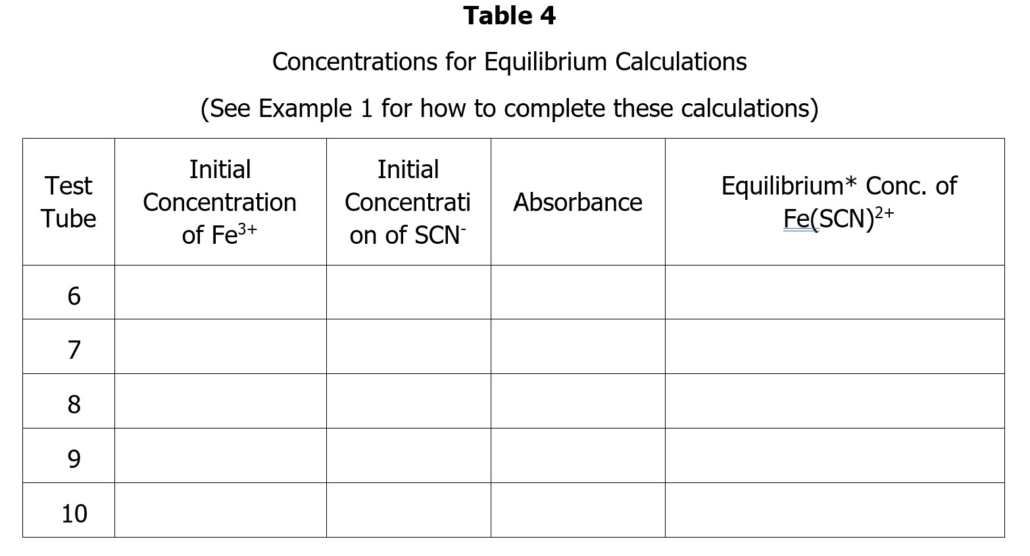
Since this is a more complicated lab, I have created recommended data tables to help you organize your data. These are provided in the prelab. Some of the data should be completed before coming to lab. I have outlined what needs to be completed before coming to lab in the prelab assignment.
Safety Information
The safety data sheets for each of the chemicals we will use in this week’s lab are linked below. While will work with very dilute concentrations of these chemicals, I encourage you to review their SDS before coming to lab.
- Iron (III) Nitrate can cause skin irritation/burns and eye damage.
- Potassium Thiocyanate (KSCN) is harmful if swallowed or inhaled. Avoid contact with skin and eyes.
- Nitric Acid is an oxidizer and may intensify fire. It may be corrosive to metals, can cause severe skin burns and eye damage, and is toxic if inhaled.
Nitrile gloves and chemical aprons are available for student use in the chemistry lab. Wear your goggles throughout this lab.
Pre Lab Lecture Video
Click on the image to the right to watch the pre-lab lecture video for this experiment. The information in this video will help you come to the lab prepared to complete this experiment.
Video 2.0 – Pre-lab lecture video. Click on the image above to view the video. It will open in a new window.
Pre Lab Assignment
Answer the questions below before the start of the lab. They are due at your teacher’s desk before the beginning of the lab. Failure to complete these questions before the start of the lab will result in a zero for this experiment. (10 points)
- Write the equilibrium expression you determined from Equation 1 in the introduction. Include this information in your lab notebook. Your instructor will check your lab notebook for this information at the start of class. (1 point)
- The trendline equation for the line in Figure 1 is y = 4312x + 0.0075. If an unknown Fe(SCN)2+ concentration has an absorbance reading of 0.250, what is the Fe(SCN)2+ concentration? (2 points)
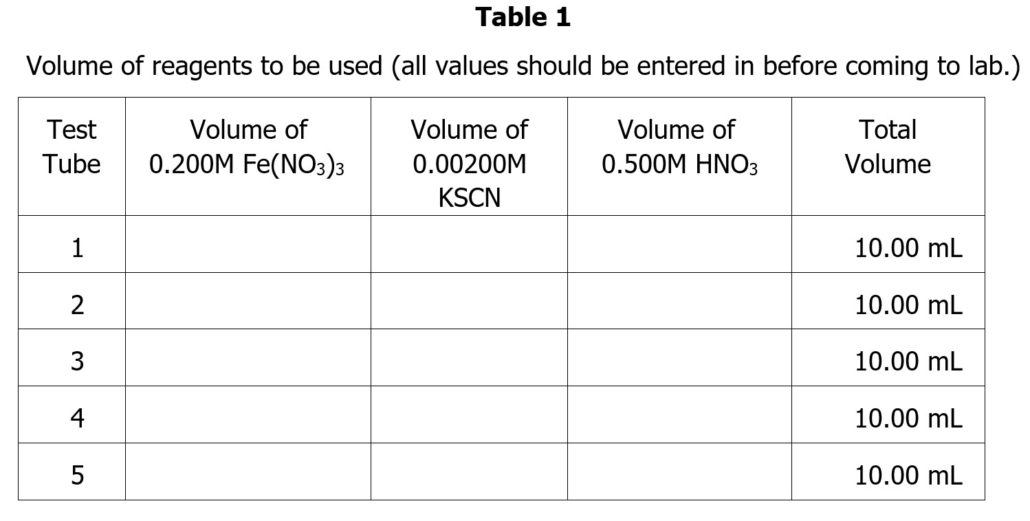
- Set up Tables 1-4 in your lab notebook (provided below). You will need to fill in the values for Table 1 and Table 3 before coming to class using data provided in Part 1 (Table 1) and Part 3 (Table 3). Fill in those values in your lab notebook. Your instructor will check your lab notebook for this information at the start of class. (7 points)
Standard Curve Data
Equilibrium Data
Experimental Procedure
Experimental Materials
0.200 M Iron (III) Nitrate, Fe(NO3)3
0.00200 M Potassium Thiocyanate, KSCN
0.5 M Nitric Acid, HNO3
0.00200 M Iron (III) Nitrate, Fe(NO3)3
10 test tubes
600mL beaker (labeled “waste”)
Spectrophotometer
Label tape
10mL graduated cylinder
Kimwipes
2 Cuvets
Thermometer
Vortex Stirrer
Laptop with access to MSExcel
Printer
NOTE: The concentrations listed for the chemicals we use this week are approximate. Be sure to record the exact concentration from the side of the bottle to use in your calculations.
There are two different concentrations of the Fe(NO3)3. Double-check the container to ensure you are using the correct concentration.
Do not write on or put stickers on the cuvets, as this could interfere with the absorption readings.
Part 1: Gathering Data for a Standard Curve (Beer’s Law Plot)
- Obtain 5 clean and dry test tubes (NOT cuvets) labeled 1-5 and fill each with exactly 2.50 mL of 0.200 M Fe(NO3)3 using a buret. Record the exact volume to the nearest 0.02 mL.
- Using a buret, add the following amount of 0.00200M KSCN to each test tube:
- Test Tube #1 – exactly 0.50mL 0.00200M KSCN
- Test Tube #2 – exactly 0.75mL 0.00200M KSCN
- Test Tube #3 – exactly 1.00mL 0.00200M KSCN
- Test Tube #4– exactly 1.25mL 0.00200M KSCN
- Test Tube #5 – exactly 1.50mL 0.00200M KSCN
- Finally, add enough 0.5 M HNO3 to each of the test tubes so that the final volume in each tube totals 10.00 (The volume of HNO3 should have been calculated beforehand as part of the pre-lab assignment.) Mix thoroughly by covering with Parafilm and mixing with the vortex stirrer.
- Examine the cuvets you are using before adding any solution to them. Be sure they are clean and dry. If a cuvet is wet, rinse it a couple times with small quantities of the solution you are about to use. Place the waste from rinsing the cuvet in the waste beaker at your station. Pour the contents of each test tube into a cuvet, filling it about ¾ Set the spectrophotometer to 447 nm and zero the instrument with a cuvet filled with 0.5 M HNO3 (this is your blank). Remember to wipe the sides of each cuvet with Kimwipes before placing it into the instrument. Record the absorbance starting from the most weakly absorbing and working towards the most intensely colored. Do not cleanup until you have produced an acceptable Standard Curve (see below.)
Part 2: Creating the Standard Curve (Beer’s Law Plot)
Summarize the data needed to produce the standard curve by completing the tables in your lab notebook. Remember that the concentration of Fe(SCN)2+ equals the initial concentration of SCN–. Prepare the graph using Excel. Include the data for the blank in your graph. There should be 6 points in your graph. Display the trend line and the R2 on your graph. Title your graph, label the axis and indicate the units of measurement, and include the equation for the line and R2 value on your graph. Your data points should all lie close to the trend line. If not, you may have to prepare fresh samples for one or more of your data points. Consult with your instructor. This is why the graph should be completed in class before you clean up!
Print a copy of your graph and glue it in your lab notebook.
Part 3: Gathering Equilibrium Data
- Obtain 5 clean and dry test tubes and fill each with 5.00 mL of 00200 M Fe(NO3)3 using a buret. If a test tube is wet, rinse it several times with small portions of the solution. Label the test tubes 6 through 10.
- Using a buret, add the following amount of 0.00200M KSCN to each test tube:
- Test Tube #1 – exactly 1.00mL 0.00200M KSCN
- Test Tube #2 – exactly 2.00mL 0.00200M KSCN
- Test Tube #3 – exactly 3.00mL 0.00200M KSCN
- Test Tube #4– exactly 4.00mL 0.00200M KSCN
- Test Tube #5 – exactly 5.00mL 0.00200M KSCN
- Finally, add enough 0.5 M HNO3 to each test tube so that the final volume in each tube totals 10.00 (The volume of HNO3 should have been calculated beforehand.) Mix thoroughly using the Vortex stirrer.
- Record the temperature of one of your samples in your lab
- Measure the absorbance for each of the five samples and record this data in your lab notebook.
Waste Disposal
- Place all chemicals in the proper waste container in the hood.
- Wash the burets and return them and the stands to your instructor.
- Place the used test tubes in the container on your instructor’s desk. They will be placed in the dishwasher for cleaning.
- Wash any glassware that came from your drawer (rinsing with DI water) and place it back in the drawer.
- Rinse the cuvets with DI water several times and return them to the front table. Do not dry them with a paper towel at it may scratch the cuvet.
Post Lab Assignment
Once you have completed this experiment and recorded all of your data in your laboratory notebook:
- Write the discussion and conclusions sections for the lab. The questions in the post-lab assignment will help you process the data from this lab. Be sure to include all of the calculations from the post-lab assignment in your lab manual.
- Include all concentration/dilution calculations in your lab notebook.
- Paste a copy of the Beer’s Law Plot in your lab notebook.
- Use the trend line equation from the standard curve (Beer’s Law Plot) to calculate the concentration of Fe(SCN)2+ in each tube (test tubes #6-10). Include all your calculations in your lab notebook and record you data in Table 2. (created in the prelab).
- Complete the ICE Table for each of the 5 samples (test tubes #6-10) and enter the equilibrium constant values into a table summarizing them for easy reference. (Reminder: Do not write “X” but put the actual values in.) Calculate an average for the equilibrium constant. What was the range for your calculated Keq values? Comment on the precision of your data.
- I provided some guidance in the prelab video (starts about 3:35) and in the Where Do We Go From Here video posted at right. Click the image to play this video
- Complete the post-lab assignment and submit it to your instructor.
Experimental Determination of an Equilibrium Constant Post-Lab Assignment (15 points)
Answer the following questions using the information you gathered during today’s lab. This assignment is due at the start of the next lab period.
- Show your calculations for the concentration of Fe(SCN)2+ for test tube 6. Write your answers for the other trials below your work for test tube #6. (6 points)
- Show your calculations for the Keq for this reaction for test tube #6. Write your answers for the other trials below your work for test tube #6. (6 points)
- What is the average Keq for this reaction? (1 point)
- What are two errors you encountered during this lab? How could they have impacted your results? (2 points)
References
Sigma Aldrich. “Iron (III) Nitrate.” Datasheet, Sept. 2024. https://www.sigmaaldrich.com/IN/en/sds/aldrich/529303?srsltid=AfmBOoqy0VTb7KPsX6E8RxKdluShZPXwHAjNa13K0vpgAkcdgU9WWmGT
Sigma Aldrich. “nitric acid.” Datasheet, [Revised Sept. 2024]. https://www.sigmaaldrich.com/GB/en/sds/sial/695041?userType=undefined&srsltid=AfmBOooTbM_eZh00nH8qO1v8CuTUieC6yrzZwAUcCtqZsDYj5KHj6Dk4
Sigma Aldrich. “potassium thiocyanate.” Datasheet, [Revised Mar. 2024]. https://www.sigmaaldrich.com/IN/en/sds/sigald/p3011?srsltid=AfmBOorxM8Qc3a0QvwNDiD21_99vLCINO97eEe8Jg3g7wXDyWr3eTFzn
Thermo Fisher Scientific Inc. (2015, March). Genesys 30 Spectrophotometer User Guide. https://knowledge1.thermofisher.com/@api/deki/files/4661/269-317300_-_Rev_A_-_GENESYS_30_Spectrophotometer_User_Guide.pdf?revision=1
University of Missouri. Determination of an Equilibrium Constant. Accessed on January 5, 2020. https://chemistry.missouri.edu/sites/default/files/class-files/use_det_eq_const_1.pdf
This page was published on February 11, 2024 and last updated on March 31, 2025.
©Catherine Haslag 2025. All Rights Reserved.


