ObjectivesIntroductionPre Lab AssignmentExperimental ProcedurePost Lab AssignmentFormal Lab ReportReferences
Objectives
- Conduct laboratory work in compliance with guidelines for personal lab safety and responsible management of chemical waste; this includes appropriate use of personal protective equipment and interpretation of Globally Harmonized System for Hazard Communication (GHS) labels.
- Measure quantities such as mass, volume, temperature, and absorbance with proper technique, and record the results of measurements with the appropriate number of significant figures and units.
- Record observations of chemical processes (such as precipitate formation, gas evolution, etc.) and write chemical reactions consistent with their observations.
- Demonstrate proper techniques for laboratory procedures, such as titration, filtration, solution preparation, spectrophotometric measurements, etc.
- Demonstrate proper use of glassware and equipment including beakers, Erlenmeyer flasks, volumetric pipets, burets, volumetric flasks, watch glasses, graduated cylinders, filtration apparatus, single-beam spectrophotometer, pH meter, balances.
- Communicate lab procedures, observations, and results in the form of laboratory notebook, written reports, and verbal presentations effectively.
- Interpret and analyze qualitative observations and quantitative results, incorporating graphs and tables as appropriate.
- Perform an in-depth analysis of an experiment, including statistical analysis of error, explaining the sources of error (% error), and uncertainty.
- Apply knowledge of colligative properties of solutions, thermodynamics, and equilibrium to problem-solving and experimentation.
- Determine the molecular mass of an unknown compound using freezing point depression.
- Experimentally determine the freezing point of a solution.
- Calculate the molality of a solution.
- Identify errors and explain their effect on experimental data.
- Draw conclusions based on experimental data.
Introduction
In this lab, we will determine the freezing point of a pure solvent and a solution containing a metal salt, cobalt (II) chloride. Before coming to the lab, read the textbook (Section 11.4) on colligative properties, including freezing point depression. Key terms, concepts, and example problems for calculating freezing point depression are all provided in the textbook.
In this week’s lab, we will experimentally determine the van’t Hoff Factor (i) for the cobalt (II) chloride using freezing point depression. You will create several aqueous solutions of cobalt (II) chloride and determine their freezing point. You will then use the formulas for freezing point depression, the morality of the solutions you created, and the experimental data you collect during the lab to calculate the van’t Hoff Factor. You will also graph your data and determine the R2 value and calculate the percent error to assess the precision and accuracy of your data.
Calculations
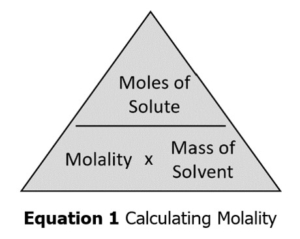
We will perform several calculations in this lab, including molality (Equation 1) and change in temperature (Equation 2).
The type of solvent used determines the formula used to calculate freezing point depression. If the solute ionizes, the freezing point change will be impacted differently from a compound that doesn’t ionize. If the solute is a covalent compound, Equation 3 is used to determine the new freezing point of the solution. The number of ions formed when the compound dissociates in the solvent must be considered if an ionic compound is used. This is done using the van’t Hoff Factor, (i). This value can be estimated by determining how many ions will form when the ionic compounds disassociate in water. For instance, NaCl forms Na+ and Cl– ions when it dissociates in water, so the van’t Hoff Factor is approximately 2 for sodium chloride. Equation 4 should be used for solutions containing ionic solutes.
Graphing Data
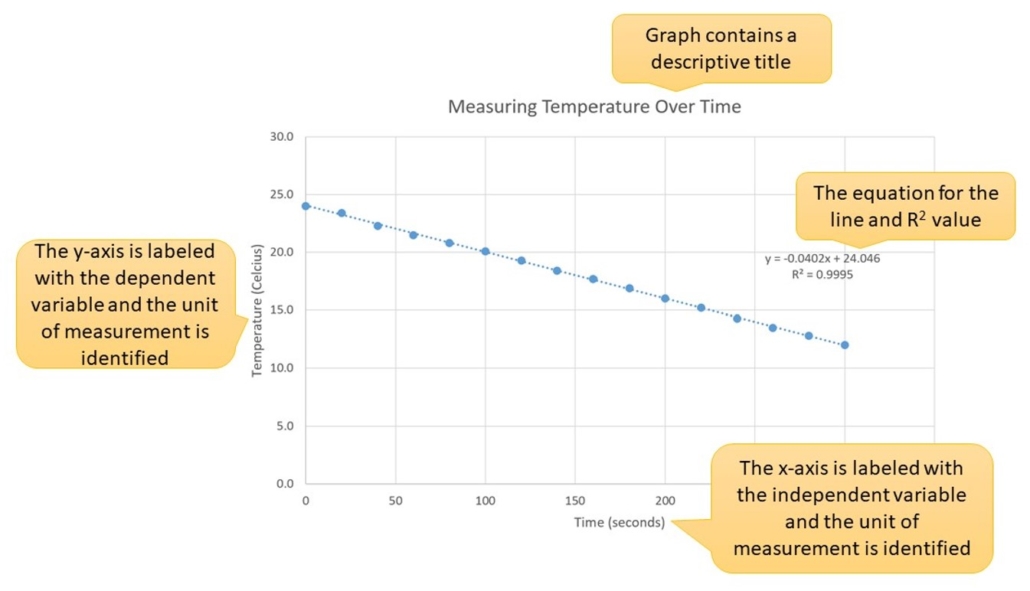
We will be graphing this week’s data. When graphing experimental data, the independent variable goes on the x-axis and the dependent variable on the y-axis. Always label all axis, identifying what is measured and the units used for the measurements. Next, title the graph and include the equation for the line and the R2 value. The R2 value indicates how closely your data points fit the line. The closer the R2 value is to 1, the more accurate your data points are, the closer they fit the line, and the more reliable your equation will be. Video 1.0 demonstrates how to graph data using Excel and display the trend line and R2 value. An example of a well-prepared graph is provided below in Figure 1.0.
Write the formulas associated with calculating freezing point depression in the introduction of your lab manual. You will need them for this week’s experiment.
You will also be calculating percent error in this lab. Figure 2.0 illustrates the formula for determining this value. Your percent error should always be positive. Drop the negative sign from the value if you ever figure a negative number.
Creating a Data Table
You will need to create a data table for this lab. I recommend you set it up before coming to the lab, as it will make your experiment go easier and keep your data neatly organized.
When designing your data table, consider what you measure in the lab. You need to create space to record that data in your table. Also, consider any data you need to calculate during the lab. For example, in this week’s lab, we added approximately 0.300g of Cobalt (II) Chloride to a volume of water four times. You will need to record the exact amount of solute added to the test tube each time; however, you will also need to determine the total mass of solute present in each sample. Therefore, creating a column in your data table to record the amount added and calculate the total solute present in each sample is helpful. This will simplify your post-lab calculations because you can do some simple steps during the experiment.
Consider also what you ultimately need to find the values necessary to graph the data for this experiment. For example, what are we graphing in this lab? What data do you need to gather to graph this information? You may want to create space in your data table to include the answers to these calculations to help organize your results and make it easier to graph the values.
Video 1.0 (above) – How to graph using Excel.
Figure 1.0 (below) – Example of a well-designed graph.
Figure 2.0 (above) – Percent Error Formula
Video 2.0 (below) – How to design a data table.
Safety Information
Cobalt (II) chloride can cause skin irritation, difficulty breathing or can cause cancer if inhaled, and is harmful if ingested. Please review the safety data sheet for this chemical for more safety information.
Nitrile gloves and chemical aprons are available for student use in the chemistry lab. Wear your goggles throughout this lab.
Pre-Lab Lecture Video
Click on the image to the right to watch the pre-lab lecture video for this experiment. The information in this video will help you come to the lab prepared to complete this experiment.
Lecture videos that provide examples of completing freezing point depression calculations are available on Brightspace.
Video 3.0 – Pre-lab lecture video. Click on the image above to view the video. It will open in a new window.
Freezing Point Depression Pre Lab Assignment
Answer the questions below before the start of the lab. They are due on your teacher’s desk before the beginning of the lab. Failure to complete these questions before the start of the lab will result in a zero for this experiment. (10 points)
- In your own words, what does the van’t Hoff factor (i) measure? (1 point)
- Write the equation for cobalt (II) chloride dissolution in water below. What is the theoretical (ideal) van’t Hoff factor for cobalt (II) chloride based on this equation? (2 points)
- Explain the difference between molality and molarity? (1 point)
- You will measure the temperature of a CoCl2. How will you know that the sample is in the process of freezing? Identify physical observations and experimental data changes that indicate freezing is occurring. (2 points)
- What NaCl(s) mass must be added to 500 mL of DI water (Kf H2O= 1.86 °C·kg/mole, d =1.00g/mL) so the solution freezes at –15 °C? You must show all of your calculations to receive credit. (2 points)
- You dissolve 41.7g of an unknown nonelectrolyte is dissolved into 235g of water to make a solution. The freezing point of the solution is measured to be -5.53°C. Calculate the molar mass of the solute. (2 points)
Experimental Procedure
Experimental Materials
Digital Thermometer
Analog (glass) thermometer
Graduated Cylinder
DI Water
Cobalt (II) Chloride (solid)
Rock Salt
Beakers (600mL, 400mL and 250mL)
Ring Stand
Clamp
Watch Glass
Large Test Tube
Rubber stopper with hole
Vortex Stirrer
Paper Towels
Aluminum Foil
Tape
Computer with Excel (for data analysis)
Part 1: Determination of the freezing point of DI water
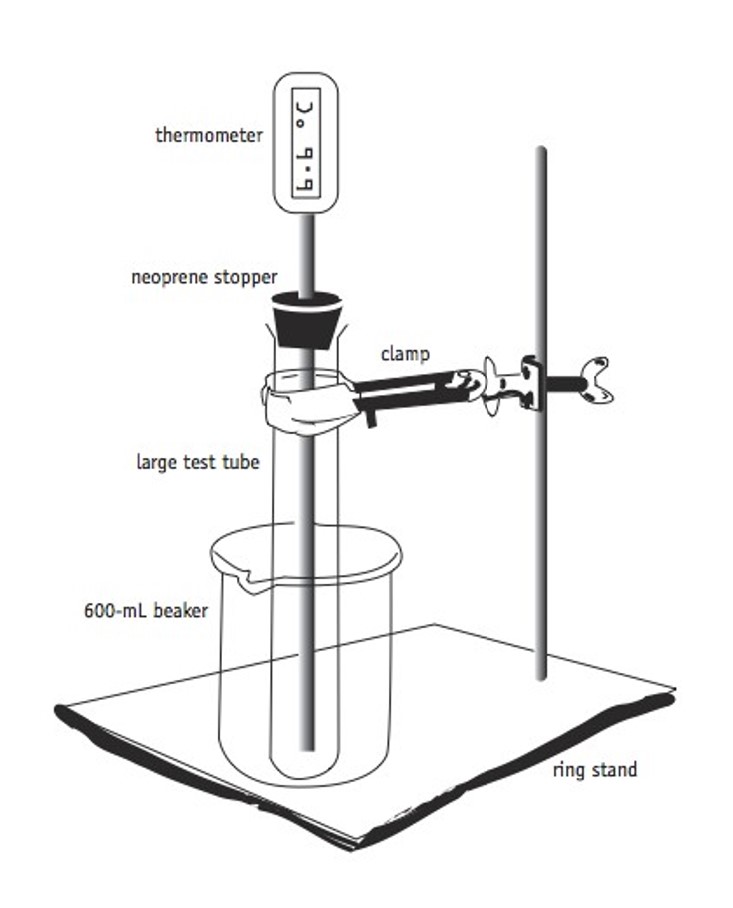
- Setup the equipment illustrated in Figure 3 using a test tube, stopper with hole, digital thermometer, clamp, and ring stand.
- Measure approximately 25mL of DI water. Record the exact volume used in your lab notebook using significant figures. Pour the DI water into the test tube.
- Prepare an ice bath in the 600mL beaker using ice and rock salt (approximately 300mL of ice to 100mL of rock salt). Stir with a spatula to mix. Using a glass thermometer, measure the temperature of the mixture. Continue to add ice and rock salt until the mixture temperature stays below –10 °C. DO NOT use the digital thermometer to measure this solution. Monitor this solution throughout the experiment. If the temperature of the ice/rock salt solution goes above –10 °C, mix the ice/rock salt with a spatula. If the temperature still does not go below –10 °C, make a new ice/rock salt mixture.
- Once the desired temperature is reached, wrap a generous layer of paper towels around the beaker and cover the outside with aluminum foil. Use tape if necessary to hold this insulating layer together around the beaker.
- Add approximately 250mL of water to the 400mL beaker. This beaker will be used to melt the solution in the test tube between trials.
- Place the stopper on the test tube and insert the digital thermometer through the hole in the stopper so the thermometer is pointing straight down. Be careful not to let the thermometer touch the sides of the bottom of the test tube. This will ensure you are measuring the temperature of the solution and not that test tube.
- Place the test tube containing DI water into the ice bath. The test tube of DI water should be completely submerged in the ice bath throughout the experiment. Immediately record the temperature of the DI water upon immersion (initial t = 0 sec) and every 20 sec until the water freezes. This should be around 0 °C. NOTE: You should observe three zones of cooling behavior: (1) the temperature will rapidly decrease after it is placed in the ice bath; (2) the temperature decrease will slow significantly and almost plateau as it approaches the freezing point; (3) the temperature will suddenly increase as the solution freezes. The freezing point is when the temperature of the solution stops changing when it freezes. You should also see ice crystals form quickly when the solution freezes.
- Once you have determined the freezing point of the DI water, place the test tube in the room-temperature beaker of water to melt it.
Figure 3.0 – Equipment setup. (Boston)
Part 2: Determination of the freezing point of five solutions containing Cobalt (II) Chloride
NOTE: Be sure to check the temperature of the ice/rock salt mixture at the start of each trial (new solution) and make adjustments to ensure the temperature stays below –10 °C.
- Measure about 0.300g of cobalt (II) chloride and record the exact mass in your lab notebook. Add this solute to the DI water in the test tube from Part 1. DO NOT get fresh water. Once the CoCl2(s) is fully dissolved (you may use a vortex stirrer to help with this process), replace the stopper and thermometer. This is Solution #1.
- Determine the freezing point of Solution #1 as you did the DI water in Part 1. The test tube of DI water/CoCl2(s) should be completely submerged in the ice bath throughout the experiment.
- Once you have determined the freezing point of Solution #1, place the test tube in the beaker of room-temperature water until it melts.
- Prepare Solution #2 by adding another 0.300g of cobalt (II) chloride to the test tube and find the solution’s freezing point. Once you have determined the freezing point of Solution #2, place the test tube in the beaker of room-temperature water until it melts. Record all of your data on the data table in your lab notebook.
- Repeat this process (Step #3) for solutions #3, #4, and #5, adding approximately 0.300g of CoCl2(s) for each sample and recording the amount added for each solution and the solution’s freezing point in your lab manual.
Waste Disposal
- Place the cobalt (II) chloride solution in the proper waste container in the hood. These solutions CANNOT go down the drain.
- Dispose of the sodium chloride/ice solution down the drain.
- Place the paper towels and aluminum foil in the trash.
- Wash any other equipment used with soap and DI water (the final rinse is with DI water) before putting it away.
Post Lab Assignment
Once you have completed this experiment and recorded all of your data in your laboratory notebook:
- Write the discussion and conclusions sections for the lab. The questions in the post lab assignment will help you process the data from this lab. Include all of the post-lab assignment calculations in your lab manual.
- Complete the post lab questions provided below and submit them to your instructor. Show ALL of your calculations on your post lab assignment.
- Include a printed copy of the graph you create in the post lab in your lab notebook. I posted a video on how to create this graph in the introduction.
Freezing Point Depression Post-Lab Questions (15 points)
- Calculate the experimental van’t Hoff Factor for CoCl2(s) from the data you collected during lab. (Kf,H2O = 1.86°C·kg/mole) Average the values from your trials to determine your experimental value. You must show all of your calculations to receive credit. It is ok to do this in your lab notebook and then make a photocopy of your work to submit for this question. (2 points)
- Calculate the freezing point for solutions #1 and #2 made in this experiment based on the molality of each solution and the known freezing point of water. Use the van’t Hoff Factor you determined in the prelab in your calculations. This is the ideal value for i. (Kf,H2O = 1.86°C·kg/mole) You must show all of your calculations to receive credit. (2 points)
- How do the temperature values you calculated using the ideal i value used in question #2 compare to the experimental values you obtained during the lab? Does estimating the van’t Hoff Factor by determining the number of ions formed in solution make a significant difference in the results? Explain your reasoning. (2 points)
- Using Excel or an equivalent program, graph the experimental freezing points for the solvent and five solutions (temperature vs. concentration). Title the graph and label all axes. Include the equation for the line and the R2. Attach a print-out of your graph to this assignment and glue one into your lab notebook. (5 points)
- Calculate the percent error for your experimental results for i (calculated in question #1) vs. the known (theoretical) value (i = 2.67). Explain the accuracy and precision of your data based on your percent error and the R2 value for your line. You must show all of your calculations to receive credit. (4 points)
Lab Report
You must write a lab report on the experiment and your results. Please see the guidelines on How to Write a Lab Report. The due date for this assignment is noted on the semester schedule.
Below is some experiment-specific information you will need to include in your report:
- A data table(s) outlining your results/data. There is no need to include all of the raw data for determining the solution’s freezing point. You only need to report the freezing point you measured for each solution.
- Formulas and sample calculations from the experiment. Most of these calculations were outlined in the post lab assignment.
- Include the graph you created using your data in the formal lab report (post-lab question #4).
- Include the percent error calculations for each solution (post-lab question #5).
- Discuss the accuracy and precision of the data points you collected. If you chose to throw out a data point, explain why.
- Discuss if using the ideal van’t Hoff Factor vs. the experimental value makes a significant difference in the calculated freezing point of a solution. Assume that if the difference between the values using the ideal i and experimental i are less than 5%, that the difference is not significant.
A rubric for this formal lab report can be found on Brightspace if you go to Assignment → Rubrics → Freezing Point Depression Formal Lab Report Rubric.
References
Boston University. Freezing Point Depression. Accessed on January 4, 2021. http://people.bu.edu/birubio/ch131/exp05.pdf
ScienceGonnaGetYou. (2015, October 14). How to Make a Data Table [Video]. YouTube. https://youtu.be/vatJYQEV-qA
Teacher’s Tech. (2019, April 21). How to Make a Line Graph in Excel – From Simple to Scientific. [Video]. YouTube. https://youtu.be/0jdX22qM8JA?si=ew_MerPId0HjC-3U
Sigma Aldrich. “cobalt (II) chloride hexahydrate.” Datasheet, [Revised Aug. 2024]. https://www.sigmaaldrich.com/FR/en/sds/SIGMA/C2911?srsltid=AfmBOooNBhFlEJsDV_tHrokKmrKNUTDuAHIUXkeX-bfr4gZqXL237JC_
This page was published on January 11, 2024 and last updated on February 12, 2025.
©Catherine Haslag 2025. All Rights Reserved.


