Objectives
- Conduct laboratory work in compliance with guidelines for personal lab safety and responsible management of chemical waste; this includes appropriate use of personal protective equipment and interpretation of Globally Harmonized System for Hazard Communication (GHS) labels.
- Measure quantities such as mass, volume, temperature, and absorbance with proper technique, and record the results of measurements with the appropriate number of significant figures and units.
- Record observations of chemical processes (such as precipitate formation, gas evolution, etc.) and write chemical reactions consistent with their observations.
- Demonstrate proper techniques for laboratory procedures, such as titration, filtration, solution preparation, spectrophotometric measurements, etc.
- Demonstrate proper use of glassware and equipment, including beakers, Erlenmeyer flasks, volumetric pipets, burets, volumetric flasks, watch glasses, graduated cylinders, filtration apparatus, single-beam spectrophotometer, pH meter, balances.
- Communicate lab procedures, observations, and results in a laboratory notebook, written reports, and verbal presentations effectively.
- Interpret and analyze qualitative observations and quantitative results, incorporating graphs and tables as appropriate.
- Determine the order of a reaction from the rate law.
- Describe how temperature, activation energy, and molecular orientation influence reaction rates, including the Arrhenius equation.
- Determine the rate law from a reaction mechanism.
- Describe how a catalyst influences the rate of a reaction.
- Experimentally determine the rate of a reaction.
- Perform dilution calculations.
- Identify errors and explain their effect on experimental data.
Introduction
This lab will determine the rate law for the iodine clock reaction. Before coming to the lab, be sure to read chapter 12 on chemical kinetics. Key terms, concepts, and example problems for determining the rate of a reaction, rate laws, and factors impacting reaction rate are all provided in the textbook.
Consider the reaction below:
A + B → C
The rate a chemical is consumed or produced in a reaction can be calculated using Equation 1:
Note that the rate will be negative because the concentration of A, [A], decreases. Conversely, since the concentration of C, [C], is increasing, the rate will be positive.
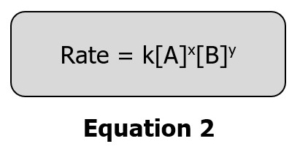
The general rate law for the above reaction considers only the reactants and can be written as:
Where k is the specific rate constant.
[A] and [B] are the molar concentrations of the reactants.
X and y are the reaction order for each of the reactants.
The rate is measured in M/sec or mole/L●sec.
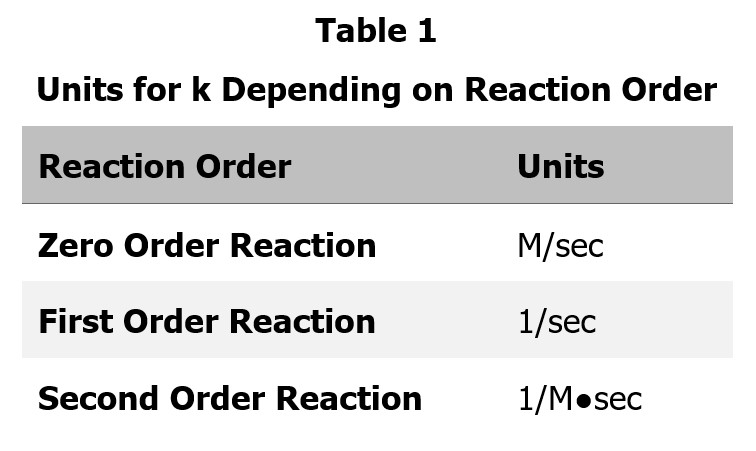
Table 1 outlines units for k depending on the reaction order.
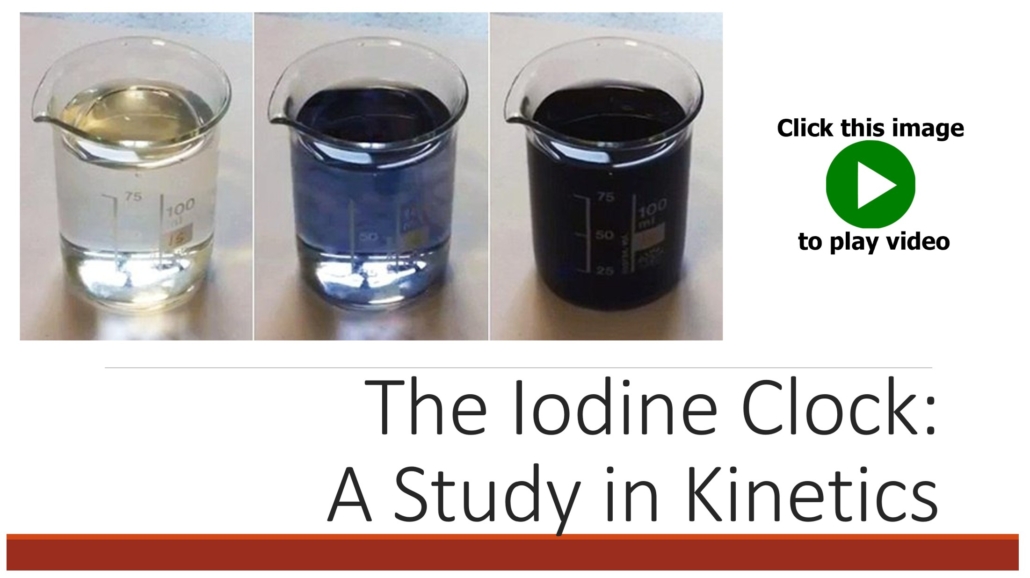
The iodine clock reaction is an excellent demonstration of chemical kinetics. Since the reaction undergoes a dramatic blue/black color change because of the start utilized, it is straightforward to identify the end of the reaction and how long it takes to occur. In this lab, we will be using a version of the iodine clock reaction utilizing potassium iodide,
sodium thiosulfate (Na2S2O3), potassium bromate (KBrO3), and hydrochloric acid. This reaction involves two steps. Reactions 1 and 2 provide net ionic equations for these steps:
Below are some important pieces of data to remember about these reactions:
- Reaction 2 happens instantaneously to Reaction 1. Therefore, since Reaction 2 happens instantaneous to Reaction 1, Reaction 1 is the rate-determining step.
- I2 forms a pale yellow, but since the concentrations in this reaction are low, it will appear colorless. All of the other ions in this reaction are also colorless. The dark blue/black witnessed during the reaction is due to the complex starch (the indicator) forms with iodine.
The color change in this reaction occurs when the moles of BrO3– are consumed, bringing an end to Reaction 1, the rate-limiting step. Therefore, we can use the rate of the consumption of the bromate ion to determine the rate in this reaction. Since the number of moles of BrO3– consumed in the reaction is so small, it will not significantly impact the rate calculations. Therefore, the reaction rate can be roughly considered 1/time for each trial. Video 1.0 explains this reaction and shows what you will observe during this week’s experiment.
Video 1.0 – The Iodine Clock
Graphing Rates of Reactions
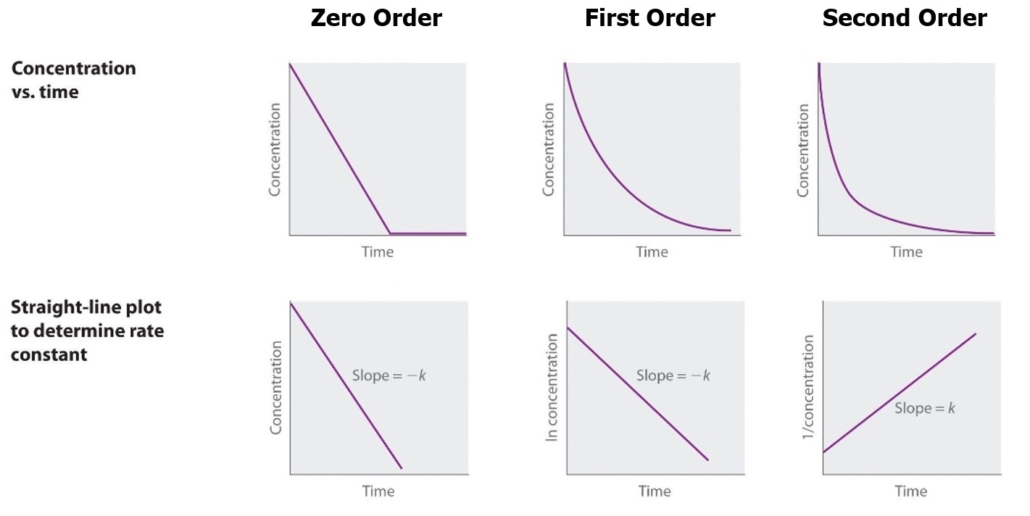
It is also possible to determine the order of a reaction by graphing the concentration vs. time. Then, based on the shape of the graph, as demonstrated in Figures 1.0 and 2.0, you can determine the order of the reactant. Do this using Excel or a similar program.
If the reaction rate does not change over time, then the reactant is zero order for the reaction. For example, if the rate vs. concentration forms a straight horizontal line, the reaction is zero order. If the rate vs. concentration forms a straight line, as shown in figure 1, the reaction is first order. If the rate vs. concentration forms a curved line, the reaction is second order.
Figure 1: Graphic Determination of Reaction Order – Rate vs Concentration (Chemninja)
Graphing concentration and time will determine the value of k, as illustrated in Figure 2. The slope of the line is equal to -k. The reaction is zero order if a straight horizontal line is created by graphing concentration vs. time. The reaction is first order if a straight line is created graphing ln concentration vs. time. The reaction is second order if a straight line is created graphing 1/concentration vs. time.
Figure 2: Graphic Determination of Reaction Order (Libre)
In this lab, we will be looking at the influence of concentration and temperature on the iodine clock reaction. In Part A, we will vary the concentrations of I–, BrO3–, and H+ to determine their order in the reaction. In Part B, we will look at the impact of temperature on the rate of this reaction.
Creating Data Tables
Since this is a more complicated lab, I have created recommended data tables to help you organize your data. The experimental procedure includes these tables and notes on how to create them.
Safety Information
The safety data sheets for each of the chemicals we will use in this week’s lab are linked below. I encourage you to review these before coming to lab.
- Potassium Iodide is a skin and eye irritant.
- Sodium thiosulfate is not a hazardous compound.
- Potassium Bromate is a strong oxidizer capable of causing fire or explosions.
- Hydrochloric acid is a corrosive acid that can cause damage to eyes and skin. It can also irritate your lungs if inhaled.
- Starch is a combustible dust with no classified physical or health risks under the Globally Harmonized System.
Nitrile gloves and chemical aprons are available for student use in the chemistry lab. Wear your goggles throughout this lab.
Pre-Lab Lecture Video
Click on the image to the right to watch the pre-lab lecture video for this experiment. The information in this video will help you come to the lab prepared to complete this experiment.
Lecture videos that provide examples of completing kinetics calculations are provided on Brightspace.
Video 2.0 – Pre-lab lecture video. Click on the image above to view the video. It will open in a new window.
Pre Lab Assignment
Answer the questions below before the start of the lab. They are due on your teacher’s desk before the beginning of the lab. Failure to complete these questions before the start of the lab will result in a zero for this experiment. (9 points)
- Write the expression for the rate at which bromate ion is consumed in this reaction using the example in Equation 1. (2 points)
- Based on the information provided in the introduction, write the generic rate law expression for the iodine clock reaction. (2 points)
- Write the rate law of the reaction A + B → C, using the experimental data provided in Table 1.0 (right). Determine the overall order of the reaction and the rate constant, k. The rate for this reaction can be calculated by taking 1/time. Show ALL of your work. You do not have enough data points to answer this question using Excel, so you must complete these calculations by hand. (5 points)
| Trial | [A] | [B] | Reaction Time |
|---|---|---|---|
| 1 | 0.10M | 0.10M | 60.3 sec |
| 2 | 0.20M | 0.10M | 29.8 sec |
| 3 | 0.10M | 0.25M | 9.7 sec |
Experimental Procedure
Experimental Materials
0.010M Potassium Iodide, KI
0.0010M Sodium Thiosulfate, Na2S2O3
0.040M Potassium Bromate, KBrO3
0.10M Hydrochloric Acid, HCl
Starch solution, 1%
Four 150mL or 250mL beakers
Hot plate with stir feature
Magnetic stir bar
Eight 250mL Erlenmeyer flasks (from the cabinets)
10mL graduated pipet and green pipetter
Three 10mL Graduated Cylinders
Plastic pipettes
Label Tape
Sharpe
DI Water
Digital timer (timer on your phone is fine)
Thermometer
Part A: Affect of Concentration on Reaction
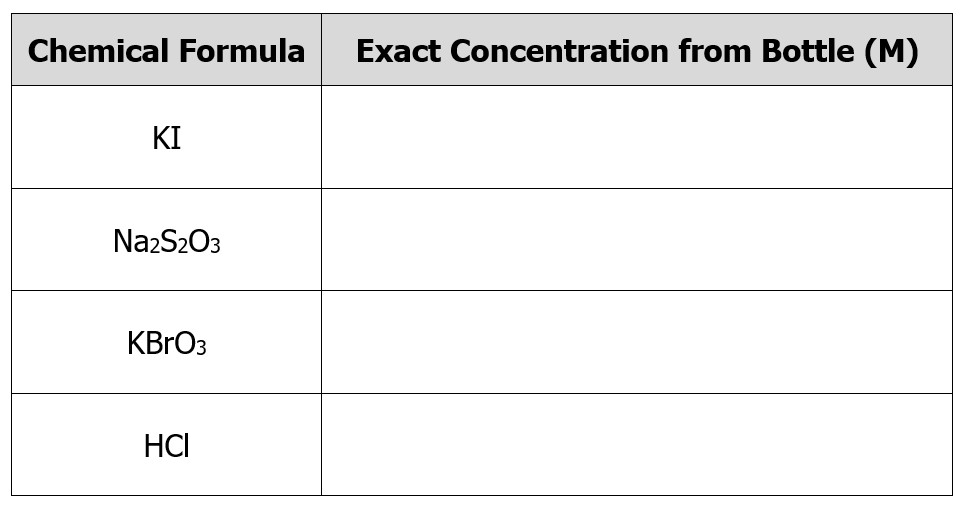
1. Obtain approximately 100mL of the KI, Na2S2O3, KBrO3, and HCl in clean, dry, labeled beakers. Obtain the exact concentrations of these solutions from the sides of the bottles and record them in a data table in your lab notebook. See Figure 3.0 for a representation of this table.
2. Label the 10mL graduated pipet with green pipettor “Na2S2O3.” You will use this to measure the amount of Na2S2O3 needed.
3. Label each of the three 10mL graduated cylinders, one for KCl, one for KBrO3, and one for HCl. You will use these cylinders to measure these chemicals for this lab. Be careful not to mix up these cylinders as it could impact your results.
Figure 3.0 – Concentration table.
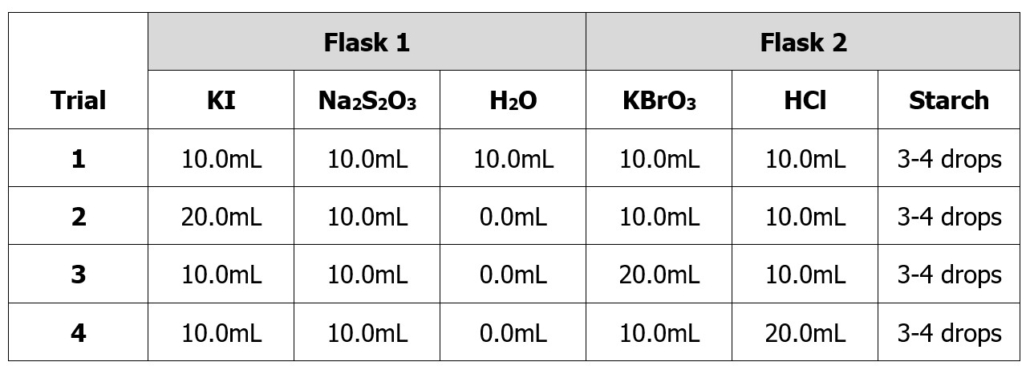
4. Obtain two 250mL Erlenmeyer flasks from the cabinet. Add the following amounts of each chemical listed in Table 2.0 for Trial 1 to the appropriate flask. It is ok if the volume you add varies slightly from the table below. You will need to copy the table below into your notebook’s experimental section. Then, recreate this table in your results section without the volumes recorded. Record the exact amount of solution you used on the recreated, blank table in your lab notebook. You will need this information for future calculations in your post-lab work.
Table 2.0 – Volumes for Part A.
PLEASE NOTE: Once you make the solutions above, the concentrations of each reactant will no longer be what is marked on the bottle. You will need to calculate the new concentration of each reactant in solution (i.e., the volume of flask 1 + flask 2). These are dilution calculations. This is why you need to record the exact volume you used, to one decimal place, on the separate table you created in your lab notebook.
5. Place the magnetic stir bar into flask 2 and set the stir option to 5 on the hot plate. DO NOT TURN ON THE HEAT OPTION. Pour the contents of flask 1 into flask 2. Begin timing as soon as the flasks are combined.
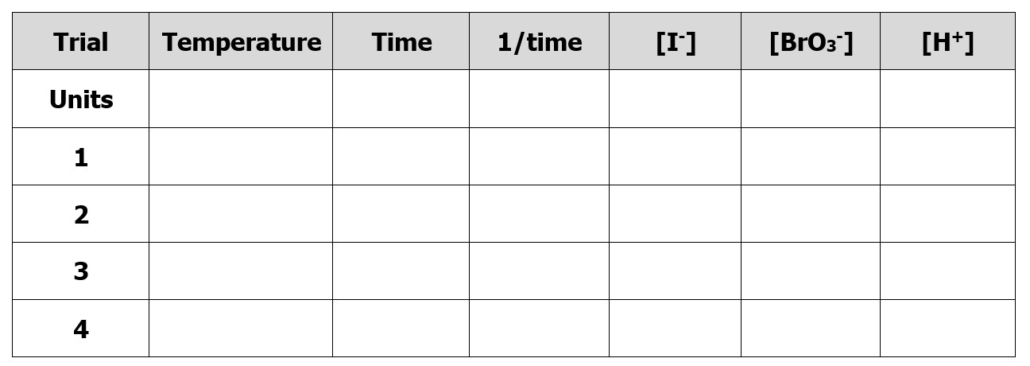
6. Record the time it takes for the solution to turn blue to the nearest second. Record this data on your data table. See the recommended table for your results section below:
Table 3.0 – Recommended table design for collecting data in Part A.
7. Repeat steps 4-6 for trials 2-4. Be sure to remove and clean the stir bar between trials before disposing of any chemicals.
PLEASE NOTE: The new concentrations of iodine, bromate, and hydrogen ions for the solutions you created should be recorded in the table provided with #6. You will use the dilution formula I discussed earlier in this procedure to complete these calculations.
Waste Disposal
- Dispose of all solutions down the sink and flush with lots of water.
- Wash any other equipment used with soap and DI water (the final rinse being with DI water) before putting it away.
Post Lab Assignment
Once you have completed this experiment and recorded all of your data in your laboratory notebook:
- Write the discussion and conclusions sections for the lab. The questions in the post-lab assignment will help you process the data from this lab. Be sure to include all of the calculations from the post-lab assignment in your lab manual.
- Calculate the k for each trial and the average k for the reaction. Remember, k is a constant for the experiment. So, hopefully, all of your k values for each trial will be very close in value. Be sure to include the proper units for k with the value you calculate. This will depend on the reaction order.
- Calculate the reaction order for each of the three reactants in the experiment by hand. Show all of your calculations in your lab notebook.
- Write the overall rate law expression for this reaction.
- Complete the post-lab assignment and submit it to your instructor.
Rates of Reaction Post Lab Questions (16 points)
Answer the following questions using the information you gathered during today’s lab. This assignment is due at the start of the next lab period.
- Attach a copy of your by-hand calculations for determining your reaction order for each reactant to your post-lab assignment. It’s ok to photocopy the calculations already in your lab notebook. No need to rewrite them. (8 points)
- Using the data from your lab, write the complete rate law you determined from this week’s experiment. (2 points)
- What is the overall order for the iodine clock reaction? (2 points)
- Based on your experimental data, how would you adjust the Iodine Clock Reaction if you wanted to double the rate? (2 points)
- Comment on the precision of the k values you calculated for this experiment. (2 points)
References
Chemninja. Topic 6/16: Kinetics. Chemninja. https://ibchemninja.weebly.com/161-rate-expression-hl.html
Global Safety Management, Inc. “potassium iodide.” Datasheet, Dec. 2014. https://www.fishersci.com/content/dam/fishersci/en_US/documents/programs/education/regulatory-documents/sds/chemicals/chemicals-p/S25864.pdf
Global Safety Management, Inc. “starch.” Datasheet, Jan 2015. https://www.fishersci.com/content/dam/fishersci/en_US/documents/programs/education/regulatory-documents/sds/chemicals/chemicals-s/S25582.pdf
Periodic Videos. (2013, Jan 18). Iodine Clock (slow motion) [Video]. YouTube. https://youtu.be/KWJpKNQfXWo
Sigma Aldrich. “sodium thiosulfate.” Datasheet, Sept 2024. https://www.sigmaaldrich.com/US/en/sds/sigald/217263
Thermo Fisher Scientific. “hydrochloric acid.” Datasheet, Aug 2009. [Revised Oct 2023]. https://www.fishersci.com/store/msds?partNumber=A481212&productDescription=HYDROCHLORIC+ACID+NF%2FFCC+21%2F2L&vendorId=VN00033897&countryCode=US&language=en
Thermo Fisher Scientific. “potassium bromate.” Datasheet, Nov. 2010. [Revised Dec. 2021]. https://www.fishersci.com/store/msds?partNumber=P207500&productDescription=POT+BROMATE+CERT+500G&vendorId=VN00033897&countryCode=US&language=en
University of California, Santa Cruz. (2011). Lab 12 – Rate Properties of an Iodide Oxidation Reaction. General Chemistry, First Edition. http://www.webassign.net/labsgraceperiod/ucscgencheml1/index.html
Libre Texts. (2020, Aug 25). 14.7: Reaction Kinetics: A Summary. Libre Texts. https://chem.libretexts.org/Bookshelves/General_Chemistry/Map%3A_General_Chemistry_(Petrucci_et_al.)/14%3A_Chemical_Kinetics/14.07%3A_Reaction_Kinetics%3A_A_Summary
This page was published on January 15, 2024 and last updated on February 24, 2025.
©Catherine Haslag 2025. All Rights Reserved.

