The Scientific Method
Objectives
- Apply knowledge of scientific theories to problem-solving applications.
- Develop a hypothesis for a scientific experiment.
- Identify the control, independent and dependent variable for an experiment.
- Predict next steps for a scientific study using data.
- Draw conclusions based on experimental data.
Related Textbook
Please read sections 1.3 and 1.4 of your textbook before beginning this activity. The textbook provides terms, concepts, and other important background information that will help you succeed on this assignment.
Introduction
The scientific method is a systematic approach scientists use to study the world around us and explain phenomena. The experiments we will conduct in the laboratory were all developed using the scientific method.
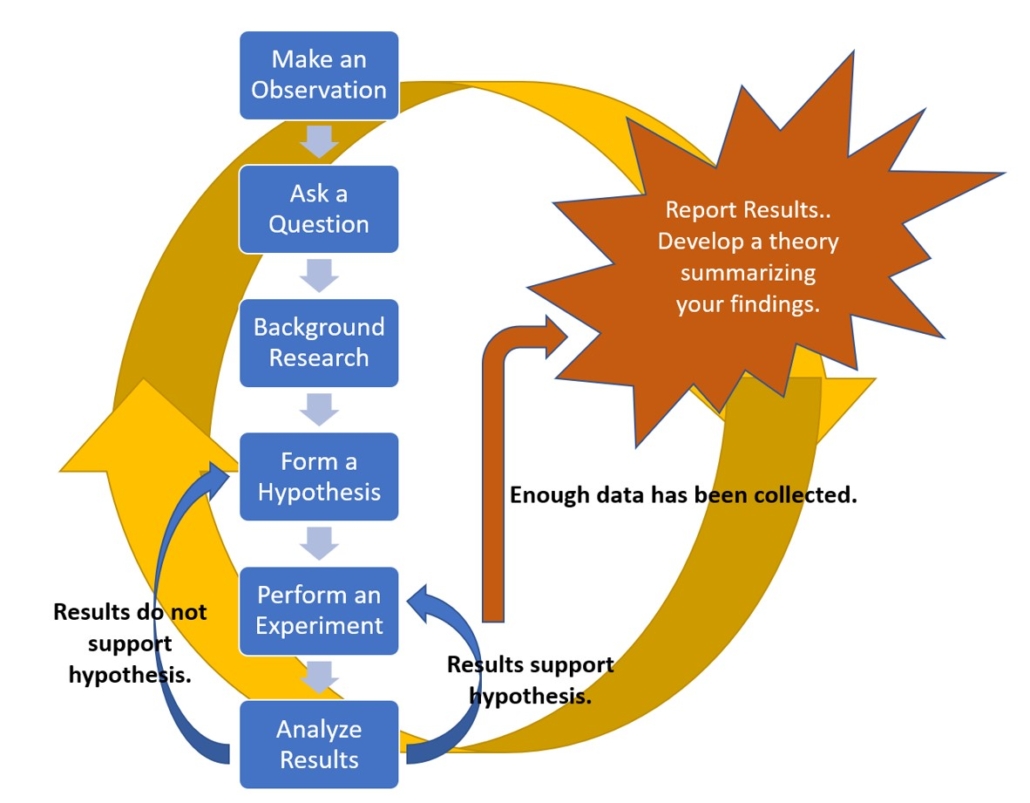
The scientific method is a cyclic process involving the following steps:
- Make an observation – What did you see happen?
- Ask a question – Define the problem
- Conduct background research – What have others reported about this phenomenon previously?
- Form a hypothesis
- A hypothesis is a tentative explanation, prediction, or guess as to what/why/how something is occurring
- Conduct an experiment that tests the hypothesis – Repeat the experiment to collect more data and make sure the same result is observed all the time
- Analyze results – Reject or accept hypothesis based on the data collected
- It is ok if a hypothesis is wrong. The experiment will let you know if your guess (hypothesis) is correct or not.
- Report results and develop a theory
Video 1.0 discusses the scientific method and demonstrates how to apply it.
Video 1.0 – The Scientific Method: Steps, Examples, Tips, and Exercise (1)
Figure 1.0 – The Scientific Method
If the data collected during the experiment does not support the hypothesis, then it is necessary to either develop a new hypothesis and test it (repeat steps 3 through 6), revise your hypothesis based on what you observed and conduct additional testing to verify, or reject your hypothesis and abandon the research. Figure 1.0 illustrates the cyclic nature of the scientific method. If the data does support the hypothesis, more data is collected until eventually enough information exists to develop a theory and report the experimental findings to the scientific community.
Please note, different sources will list a different number of steps to the scientific method. No matter how many numeric steps anyone may indicate are involved in the scientific method, the process is basically always the same.
A theory is a unifying principle that explains a group of facts but is still being tested. An example is the Theory of Relativity, which helps explain how different quantities are measured relative to space and time (E=mc2). Much data has been collected about this; however, new information is always being collected that causes minor revisions to this theory.
A scientific law is a statement about a set of phenomena that always occurs the same way under the same conditions. An example of this is the Law of Gravity. All objects have a gravitational force, pulling them toward each other. We are most familiar with the gravitation pull of our own planet, which pulls us towards the planet’s center. Laws only apply under very specific conditions. If those conditions are not present, the law does not apply.
Video 2.0 provides additional information on the difference between a scientific theory and a scientific law. Video 3.0 discussed the difference between facts, hypotheses, theory, and law.
Video 2.0 – What’s the difference between a scientific law and theory? (2)
Video 3.0 – Fact vs. Theory vs. Hypothesis vs. Law…EXPLAINED! (3)
Understanding these basic scientific terms is important so you can interpret data and draw your own conclusions.
When developing an experiment, certain aspects are typically held constant while other aspects are changed. It is important not to change too many aspects of an experiment at once or the data may not be conclusive, or clear.
- The control is the portion of the experiment that does not vary. For instance, if you want to determine how quickly fabric will fade in the sun, it would be necessary to keep a sample of the fabric away from sunlight so the original color can be compared to the other samples that were exposed to the sunlight.
- The independent variable is the portion of the experiment that is changed. This causes what will happen in the experiment. If you placed three pieces of the fabric in the sun for a different amount of time, the amount of fading that occurs would vary between the pieces of fabric. In this instance, the independent variable would be the amount of time each piece of fabric was left in the sun.
- The dependent variable is the outcome, or results, of the experiment. It is dependent on the independent variable. The dependent variable in our fabric experiment would be how much the fabric color faded. In this class, you must determine each experiment’s dependent and independent variables. You must identify these variables in formal lab reports, laboratory assignments, and exams.
- There are also controlled variables. These variables are kept exactly the same for all of the tested items. Examples of controlled variables in our fabric experiment would include using the same color fabric for each test and cutting all the fabric samples to the same size.
To report on the experimental findings, students will need to collect good data. Students will be collecting two general types of data in this class: qualitative data and quantitative data.
- Qualitative data is comprised of general observations about the experiment being conducted. This includes shape, color, relative size (large, medium, small), etc.
- Quantitative data is comprised of specific measurements involving numbers that have been collected during the experiment. Examples of quantitative data include volume, density, blood pressure, and temperature. Including units with quantitative data is important so others who read the data will know how it was measured.
Both of these types of data help to develop a picture of what is occurring and why it is happening when a phenomenon is observed. Always be sure to write down all of your observations and the data you collect when conducting an experiment. Do not rely on your memory to recall any information when collecting data because memories are not always reliable or accurate.
During this week’s activity, your instructor will lead you through a scientific study where you will develop a hypothesis, determine possible next steps for research, and draw conclusions based on the information presented. As this activity is conducted, remember there is no right or wrong hypothesis or incorrect direction of study. If the data don’t support a hypothesis, it is simply revised or recreated. The important thing is that the conclusions drawn are supported by the data that has been collected.
Assignment
- Complete the PCBs in the Alaskan Frontier Case Study – This interactive case study is linked in the laboratory section of Module 2 in Brightspace. It guides you through the application of the scientific method. This case study is based on the work of real graduate students and Ph.D. research. As you complete this case study, you ARE the scientist conducting research. Notice how we work through the scientific method as we learn more information about how PCBs found their way into remote areas of Alaska. (4, 5) Please allow 60-90 minutes to complete this case study.
- Complete the Scientific Method Electronic Assignment provided on Brightspace. This assignment is worth 10 points. This assignment will appear after you have completed the case study. If you don’t see it on Brightspace and you have completed the case study, please refresh your webpage.
Photo by Hari Nandakumar on Unsplash
References
(1) Sprouts. The Scientific Method: Steps, Examples, Tips, and Exercise [Video]. October 5, 2017. https://youtu.be/yi0hwFDQTSQ (accessed June 13, 2023).
(2) Ted-Ed. What’s the difference between a scientific law and theory? [Video]. November 19, 2015. https://youtu.be/GyN2RhbhiEU (accessed June 13, 2023).
(3) Be Smart. Fact vs. Theory vs. Hypothesis vs. Law…EXPLAINED! [Video]. September 21, 2015. https://youtu.be/lqk3TKuGNBA (accessed June 13, 2023).
(4) Tessmer, M. PCBs in the Last Frontier: A Case Study on the Scientific Method. https://www.nsta.org/ncss-case-study/pcbs-last-frontier (accessed June 13, 2023).
(5) Tessmer, M. PCBs in the Last Frontier: A Case Study on the Scientific Method. J. Coll Sci Teach. [Online]. 2005, 35(2), 34–36.
This page was created on June 16, 2023, and was last updated on January 28, 2026.
© Catherine Haslag 2026. All Rights Reserved.


