Emission Spectra Laboratory Experiment
Objectives
- Explain how emission spectra occur.
- Identify an unknown gas by observation of its emission spectra.
- Apply knowledge of scientific theories to problem-solving applications.
- Draw conclusions based on experimental data.
Related Textbook
Please read section 4.6 of your textbook before beginning this activity. The textbook provides terms, concepts, and other important background information to help you succeed on this assignment.
Introduction
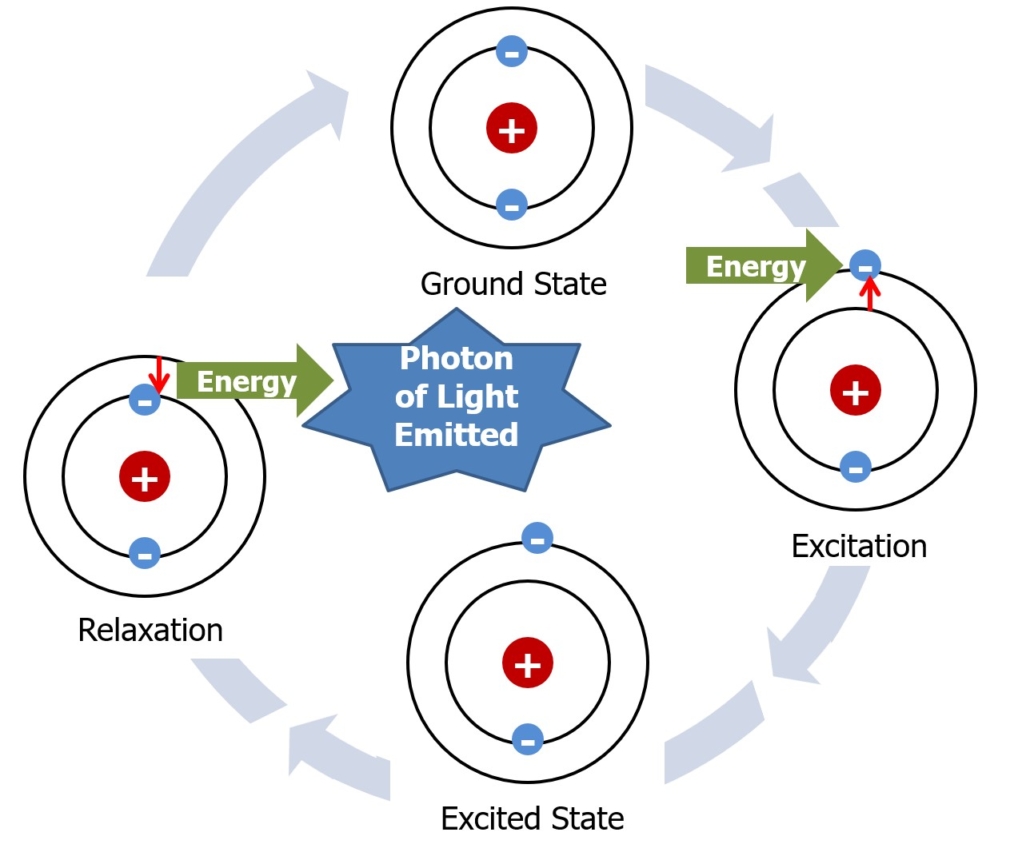
According to the Bohr Model of the atom the protons and neutrons are located in the center, or nucleus, of the atom while the electrons orbit the nucleus in a planetary-type fashion. The lowest energy state an electron can inhabit is called its ground state. However, electrons can absorb energy and jump to a higher energy level. This higher energy level is called an electron’s excited state. The more energy the electron absorbs, the further it will move from its ground state. An electron can only occupy an excited state for a very short period of time since it takes energy to keep it in this elevated state. As the electron relaxes back to its ground state, it releases the energy it absorbed as a photon of light (Figure 1). Many times, these photons fall within the visible range of the electromagnetic spectrum and can be observed with the naked eye.
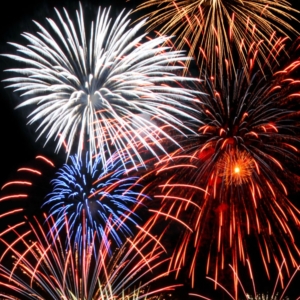
The frequencies of electromagnetic radiation (color) of light emitted by an element or compound as an electron (or electrons) relaxes back to their ground state is called emission spectra. This release of energy is something enjoyed every 4th of July during the fireworks display. The colored light observed is the result of electrons of different elements relaxing back to their ground states after being excited by the initial ignition of the firework. Figure 2 discusses how fireworks produce their brilliant colors.
Since more than one electron can be excited in an element or compound, several different frequencies of the electromagnetic spectrum can be emitted when the electrons of an element or compound are excited and then relax to their respective ground states. This produces a line spectrum that is unique to each element. Since each element’s emission spectrum is unique, spectroscopy can be used to identify the elements in matter of unknown composition. Instruments such as the atomic absorption spectrometer (AAS) use information regarding the particular set of energies that are absorbed when its electrons are excited in any given element. The energy of a particular light ray can be related to the wavelength of light and then to the element known to emit in that range or to known to create that particular line spectrum.
A more rudimentary way to observe the line spectra for an element or compound uses diffraction grating. Diffraction grating separates the different wavelengths of light in the spectrum of light emitted by a molecule much like a prism separates white light into the complete rainbow, or continuous spectrum. Without diffraction grating, only the most prominent color is observed by the naked eye, like in the use of fireworks.
In this week’s experiment, you will watch several videos demonstrating the experimental procedure outlined below. You will organize your data for this lab into a data table. Click below for a copy of the data table you will need for this lab. It will download to your computer. If you have trouble downloading it, check to ensure blockers are disabled.
Figure 1 – How an electron enters an excited state and relaxes to emit light.
Figure 2 – The Science of Fireworks Color. (1)
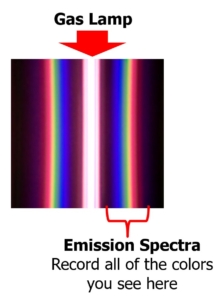
Figure 3 – What you will see in the videos in Part A of this experiment when using the diffraction grating glasses.
NOTE: You are not actually performing this experiment in your home. This week’s laboratory will be conducted using the videos provided in the experimental procedure section of this lab. The experimental procedure provided below outlines how this would be performed in the laboratory. The videos show the results of the experiment. You will need to read the procedure before watching the video to understand what is happening and how to use the videos to complete this assignment. Start watching the video on the introduction video for this laboratory and work your way down the list in the order provided in this lab. Figure 3 outlines what you will see in each video and what information you need to record on your data table. You are only interested in the colors as they appear to the naked eye and through the diffraction grating (Part A). The shape of the colors does not matter. Do the best you can. I understand that some of the colors are hard to see and may appear slightly different on different computer screens.
Experimental Procedure
Chemicals and Materials Used in Part A
Candle
Matches
Incandescent light bulb (contains a tungsten wire)
Various light bulbs containing gases
Diffraction Grating Glasses
Chemicals and Materials Used in Part B
Solutions of LiCl, CuCl2, KCl, SrCl2, BaCl2, NaCl and CaCl2
6M HCl (used to clean the nichrome wire between solutions)
Unknown solutions
Nichrome wire (used to place a solution into the Bunsen Burner)
Bunsen burner
Cobalt glass
PART A. Emission Spectra of Gases
NOTE: This part of the experiment is completed in the video playlist included in Figure 4. Below simply outlines the steps your instructor completed for Part A in these videos.
- Using the diffraction grating glasses provided by your instructor, view each light source listed in Part A of your data table.
- Record your observations for each light source on the data table.
NOTE: When recording the emission spectra of the gases listed above, you want to record the different colors that appear when the filter is applied. Figure 3 (above) is an example image indicating what you must look for and record when watching these videos. Play, pause, and rewind the videos as necessary to collect the information you require to complete this experiment.
PART B. Flame Tests of Metals
NOTE: Steps 1-5 of the experiment are completed in the video playlist included in Figure 5. Step 6 of the experiment is completed in the video playlist included in Figure 6. Below simply outlines the steps your instructor completed for Part B in these videos.
- Light a Bunsen burner. Adjust it so two separate cones are in the flame, the inner flame being a bright blue.
- Dip a nichrome wire with a loop at the end into concentrated hydrochloric acid (6M HCl) and then into the flame’s inner cone to clean the wire. Repeat this process until no color other than that of the flame is apparent.
- Dip the wire into the known solution to be tested and then place the wire loop into the flame’s inner cone. The color will appear quickly. Repeat this step if necessary to verify the color of the metal. Record the color on the data table.
- Clean the wire with the 6M HCl solution as described in Step #1. Be sure to clean your wire in between each new solution tested to prevent cross-contamination.
- Repeat Steps #3 and 4 for each known solution.
- Repeat the flame test process for each unknown solution. Record the observed color for each unknown on the data table. Identify each unknown by matching the color it emits to the color of a known solution.
Figure 4 is a playlist of videos completing the experimental procedure’s steps outlined in Part A. Please watch these videos and record the colors you see with the naked eye and the colors you see through the diffraction grating glasses on your data table. Remember that the shape of the colors doesn’t matter.
Figure 5 is a playlist of videos completing the experimental procedure’s steps outlined in steps 1-5 of Part B. These are the known solutions. Please watch these videos and record the colors you see with the naked eye when the solution is placed in the flame.
Figure 6 is a playlist of videos completing the experimental procedure’s steps outlined in step 6 of Part B. These are the unknown solutions. Please watch these videos and record the colors you see with the naked eye when the solution is placed in the flame.
Assignment
Now that you have recorded your observations and collected the data for this experiment:
- Complete the electronic assignment for this experiment provided on Brightspace using the data you collected on your data table. Since you will complete an electronic assignment for this experiment, submitting your data table to Brightspace is unnecessary. This assignment is worth 10 points.
- Since you completed this experiment using the videos provided, there is no experimental photo to submit before completing the electronic assignment on Brightspace.
References
(1) NPR’s Skunk Bear. The Science of Firework Color. [Video]. July 3, 2017.https://youtu.be/dW5OBrB4MRM (accessed July 6, 2023).
This page was created on June 17, 2023, and was last updated on August 3, 2023.
©2023 Catherine Haslag. All Rights Reserved.


