Paper Chromatography
Objectives
- Explain how chromatography works.
- Explain how intermolecular forces apply to chromatography.
- Calculate the Rf factor for chemicals tested using paper chromatography.
- Identify errors and explain their effect on experimental data.
- Draw conclusions based on experimental data.
Related Textbook
Please read section 14.7 of your textbook before beginning this activity. The textbook provides terms, concepts, and other important background information that will help you succeed on this assignment.
Introduction
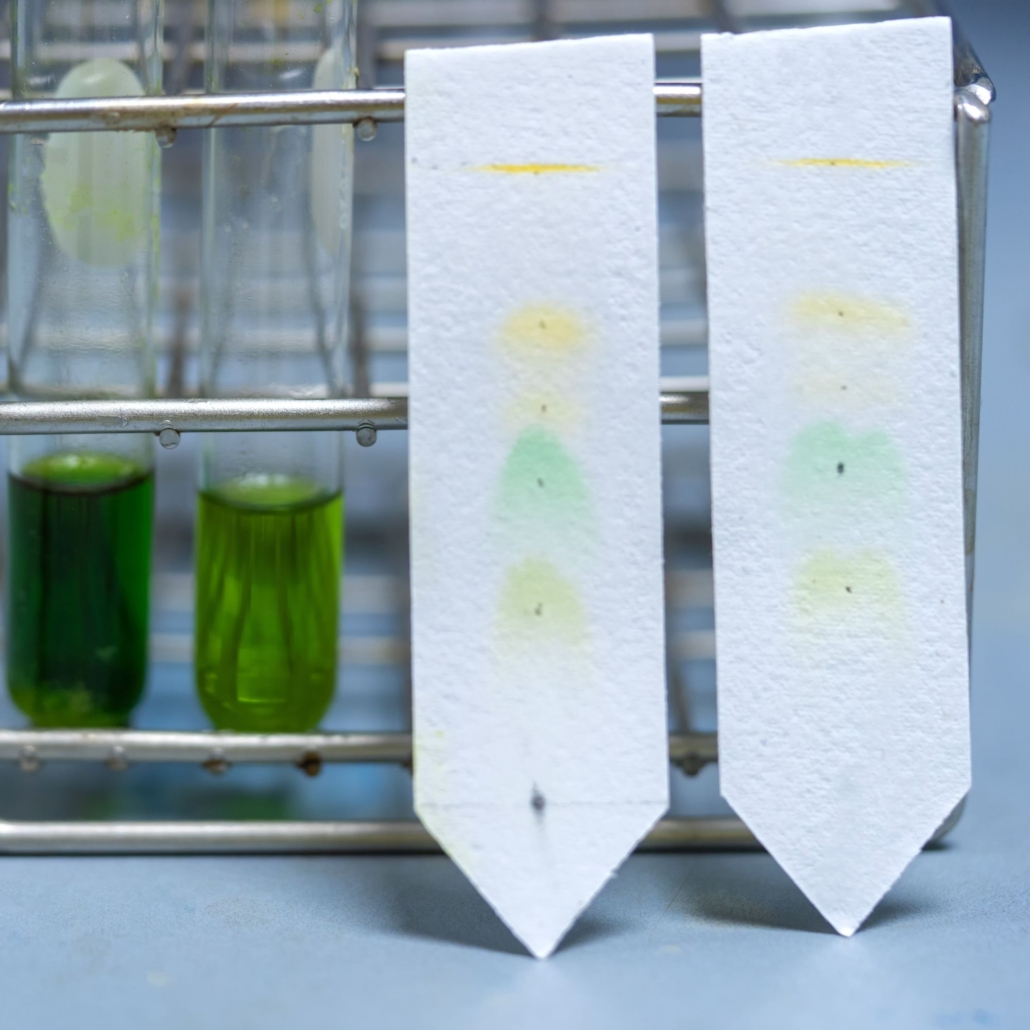
Paper chromatography is a process that uses intermolecular forces to separate the components of a sample. The more soluble a component of a sample is in the mobile phase, the further up the paper the component will travel. Figure 1.o explains this concept, provides an example of setting up this week’s experiment, and defines some key terms that apply to paper chromatography. When the samples on a piece of chromatography paper are developed, it’s called a chromatogram. An example of a chromatogram is provided at the top right of this page.
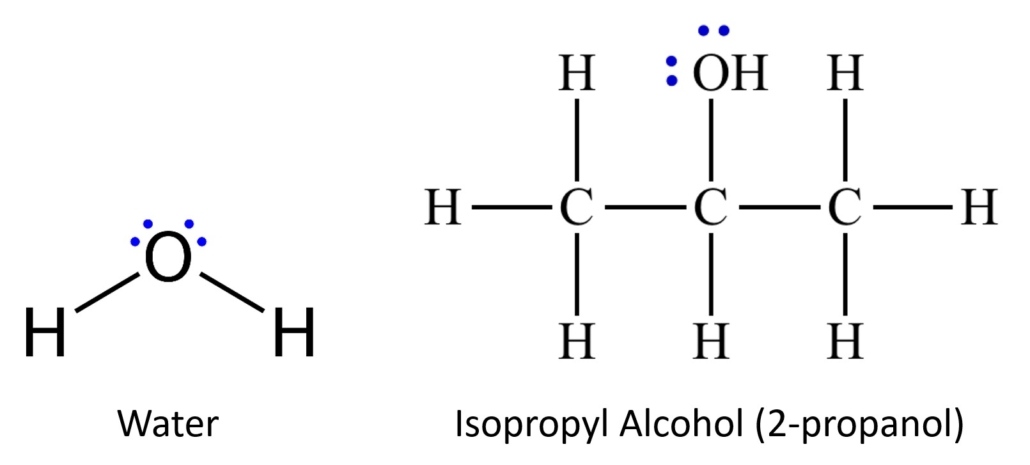
We are using two different solvents, or mobile phases, during this experiment. Water will be used in the first trial and isopropyl alcohol (also known as 2-propanol) will be used in the second trial. These two chemicals have different degrees of polarity. Chemicals can be very polar, very nonpolar, and all degrees of polar/nonpolar in between. Water is very polar. The two pairs of non-bonding electrons on the oxygen and the small structure of this molecule contribute to its strong polarity. Isopropyl alcohol also has two pairs of nonbonding electrons on the oxygen; however, it also has several carbon atoms and many more hydrogens present that increase the structure’s size and diminish the molecule’s polarity. This molecule is slightly polar, significantly less polar than the water. Figure 2.0 illustrates the structures of water and isopropyl alcohol.
Be sure to define the following terms before beginning this experiment. The video in Figure 1.0 discusses these terms. You will need to define these terms in the lab report you will complete on this lab later in this class.
- Stationary Phase
- Mobile Phase
- Rf Factor
Figure 1.0 – Paper and thin layer chromatography. (2)
Figure 2.0 – Structures of water and isopropyl alcohol. Notice the nonbonding electrons in blue.
In this experiment, we will test several different markers to see what pigments are present in each. Based on the experimental results, we will also determine if those pigments are polar or nonpolar.
You will organize your data for this lab into a data table. Click below for a copy of the data table you will need for this lab. It will download to your computer. If you have trouble downloading it, check to ensure blockers are disabled. ALL values in this lab MUST be measured in metric units.
Paper Chromatography Data Table
Safety Concerns
Isoproply alcohol is highly flammable and can cause eye irritation. Please see the SDS sheet on isopropyl alcohol for more information. (1)
Experimental Procedure
Chemicals and Supplies
90% Isopropyl Alcohol
DI water
500mL beaker
White, matte printer paper (do not use any paper that has a sheen)
Crayola Washable Markers or similar washable marker
Sharpe Marker
Pencil
Glass Rod
Metric Ruler
Scissors
Plastic Wrap or Aluminum Foil
Rubber Band
Tape
- Cut two rectangular pieces of paper approximately 9cm long by 5 cm wide. These are your chromatography paper for this experiment.
- Draw a pencil line approximately 2cm from the bottom on each piece of paper (on the 5cm/shorter side).
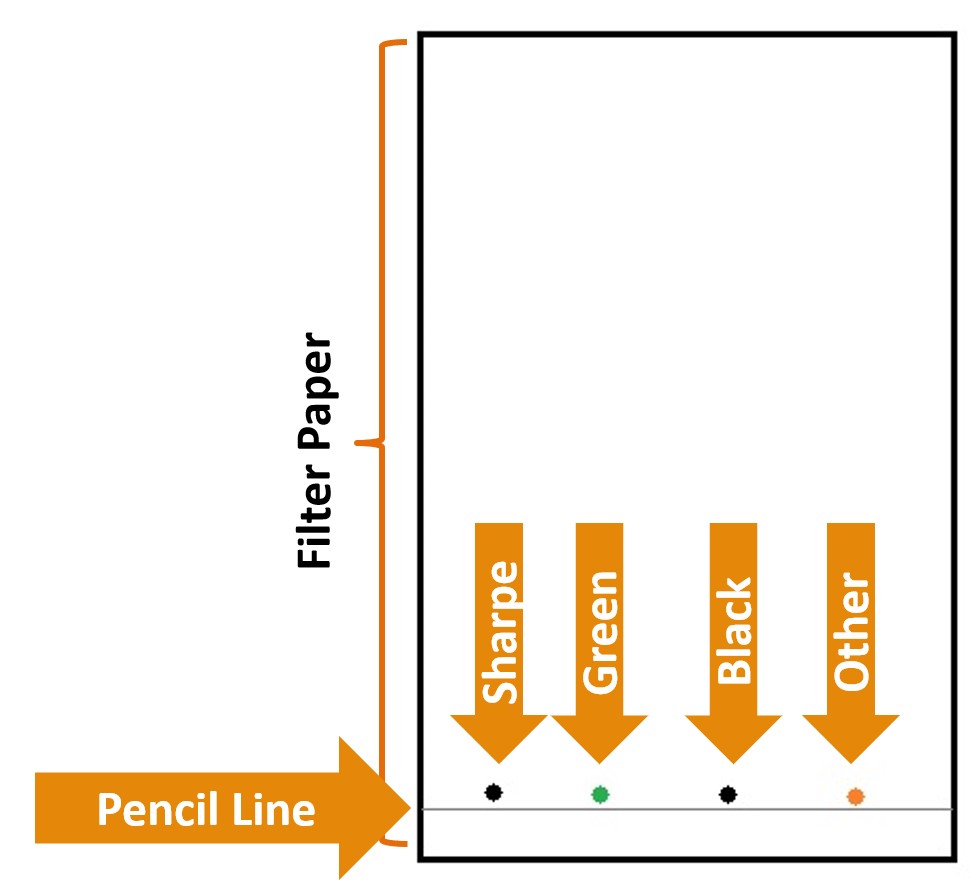
- Using the Sharpe Marker, place a dot approximately 1cm from the edge of the chromatography paper on the pencil line. Place a dot on the paper approximately 1cm from the Sharpe dot using the green marker. Using the black marker (NOT the Sharpe), place a dot on the paper approximately 1cm from the green dot. Pick another color from the pack of markers and place a dot on the chromatography paper approximately 1cm from the black dot. See Figure 3.0 for an example of the setup for this step.
- Attach the marked chromatography paper to the glass rod using a piece of tape. The marker spots should be at the bottom of the chromatography paper and the glass rod at the top.
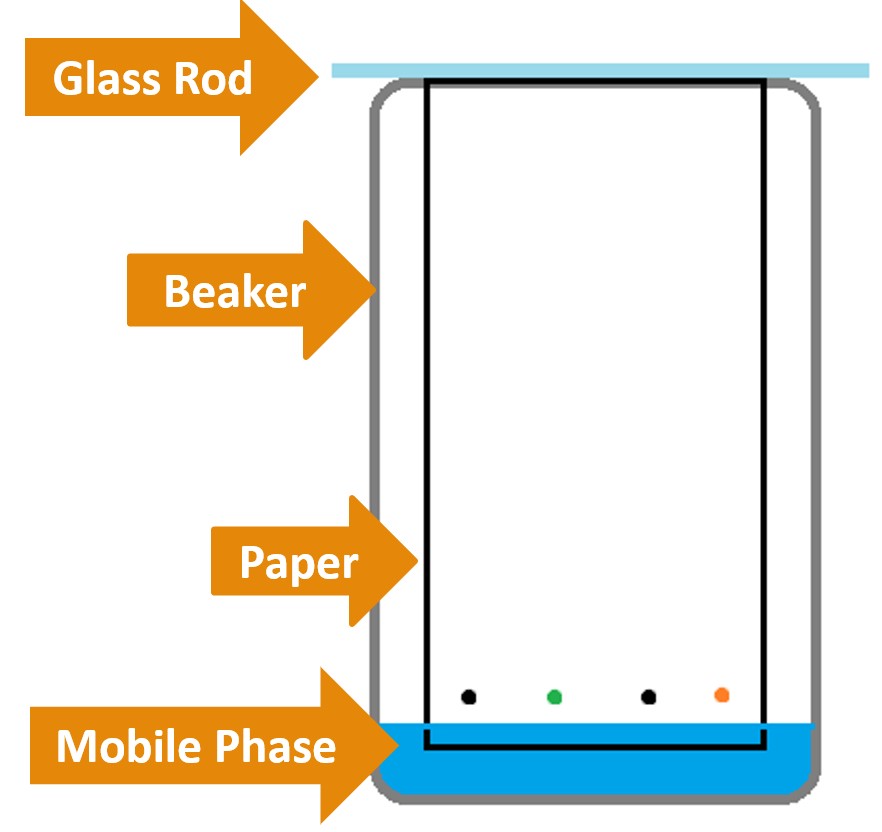
- Place the paper in the empty 500mL beaker, using the glass rod to suspend the chromatography paper in it (See Figure 4.o).
- Determine (eyeball) how much DI water should be added to the beaker without allowing the water to touch the marker dots.
- Remove the chromatography paper and add the appropriate amount of DI water to the beaker as determined in Step #5.
- Carefully add the chromatography paper to the beaker as in Step #5, being careful to allow the full end of the paper to touch the water without allowing the water level in the beaker to rise above the marker dots. If the water level in the beaker appears that it will be above the marker dots, remove some of the water from the beaker and try again.
NOTE: If the dot touches the water and start to run, you will need to prepare a new piece of chromatography paper and start again. Water will travel up the chromatography paper; however, the dots should not be submerged below the water level in the beaker.
- Cover the top of the beaker with aluminum foil or plastic wrap. Secure the foil/plastic wrap with the rubber band. The glass rod will probably stick out of the sides of the covering on the top of the beaker. This is ok.
- Allow the DI water to travel up the chromatography paper until the water level is either approximately 2cm from the top or the water level does not move for 3 minutes.
NOTE: The travel times for each solvent (water vs alcohol) will likely vary.
Figure 3.0 – Spotting the paper.
Figure 4.0 – Paper chromatography experimental setup.
- Remove the chromatography paper from the beaker. Immediately mark the solvent front. Allow the chromatography paper to dry.
- Measure the distances the colors have traveled. BE SURE TO USE CM. This was outlined in the video you viewed at the start of this experiment. Record your data on the data table provided. Do not dispose of the chromatographypaper yet.
- Repeat Steps #3 through #13 using 90% Isopropyl Alcohol instead of DI water.
- Take the picture described below after both spotted chromatography papers have been developed.
Take a photo of both chromatography papers at this experiment’s end. The pieces of paper can either be included in the same photo or two photos can be taken, each showing only one of the dry chromatography papers.
A piece of paper that includes your name, CHEM 1000, and the semester you are taking this class (for example, if you take this during the fall semester in 2023, write “Fall 2023” on the paper) should also appear in this photo. This information must be handwritten, legible, and large enough to be clearly read on the piece of paper. The assignment tied to this laboratory will not be graded unless all of these photos have been submitted to the assignment folder on Brightspace.
- Record your data on the data table provided.
- Do not dispose of the dry pieces of chromatography paper until after you have completed the attached assignment. You will need them to answer some of the post-lab questions.
Waste Disposal
- Place the used paper and any scraps in the trash.
- Dispose of the chemicals down the sink. Flush the sink with warm water after disposing of the chemicals.
- Wash any other glassware used with soap and water once the experiment is complete.
Assignment
Now that you have completed the experiment and recorded your data:
- Complete and submit the data table and the following questions for this experiment to the assignment folder on Brightspace. You must complete and submit the data table and the rest of your assignment or you will receive an automatic zero for this experiment. Your submission should be handwritten. Typed submissions will not be accepted.
- Submit the photograph(s) of the dried chromatography papers as outlined in the box under Step #14. You will receive a zero for this assignment if you fail to submit the photo.
- This assignment is worth 10 points.
Paper Chromatography Questions
- What is/are the mobile phase(s) in this experiment? Identify the mobile phase for both trials. (1 point)
- What is/are the stationary phase(s) in this experiment? Identify the stationary phase for both trials. (1 point)
- Calculate the Rf factor for each color you tested. Be sure to calculate this for each of the different colors that appeared for each of the four marker colors tested. For instance, if a color is separated into multiple spots, you need to figure the Rf factor for each spot. Show all of your work. No points will be awarded if work is missing. (4 points)
- Of the markers you tested, which are washable in water? Explain your reasoning using your experimental data. (1 point)
- Of the markers you tested, which would you predict are soluble in nonpolar solvents? Explain your reasoning using your experimental data. (1 point)
- What are two sources of error for this experiment? How would each affect your scientific data? (2 points)
References
(1) Finn Scientific. Isopropyl Alcohol 40-90% Safety Data Sheet. https://www.flinnsci.com/sds_420.5-isopropyl-alcohol-40-90/sds_420.5/ (accessed July 31, 2023).
(2) Fuse School. Tutorial: Paper and Thin Layer Chromatography [Video file]. YouTube, June 6, 2013. https://youtu.be/J8r8hN05xXk (July 31, 2023).
This page was created on July 31, 2023, and was last updated on August 3, 2023.
©2023 Catherine Haslag. All Rights Reserved.


