ObjectivesIntroductionPre Lab AssignmentExperimental ProcedurePost Lab AssignmentLab ReportReferences
Objectives
- Conduct laboratory work in compliance with guidelines for personal lab safety and responsible management of chemical waste; this includes appropriate use of personal protective equipment and interpretation of Globally Harmonized System for Hazard Communication (GHS) labels.
- Measure quantities such as mass, volume, temperature, and absorbance with proper technique, and record the results of measurements with the appropriate number of significant figures and units.
- Record observations of chemical processes (such as precipitate formation, gas evolution, etc.) and write chemical reactions consistent with their observations.
- Demonstrate proper techniques for laboratory procedures, such as titration, filtration, solution preparation, spectrophotometric measurements, etc.
- Demonstrate proper use of glassware and equipment including beakers, Erlenmeyer flasks, volumetric pipets, burets, volumetric flasks, watch glasses, graduated cylinders, filtration apparatus, single-beam spectrophotometer, pH meter, balances.
- Communicate lab procedures, observations, and results in the form of laboratory notebook, written reports, and verbal presentations effectively.
- Interpret and analyze qualitative observations and quantitative results, incorporating graphs and tables as appropriate.
- Explain how chromatography works.
- Explain how intermolecular forces apply to chromatography.
- Calculate the Retention Factor for chemicals tested using paper chromatography.
- Identify errors and explain their effect on experimental data.
- Draw conclusions based on experimental data.
Introduction
Before beginning this lab, read sections 10.1 and 10.2 in your textbook on intermolecular forces and properties of liquids.
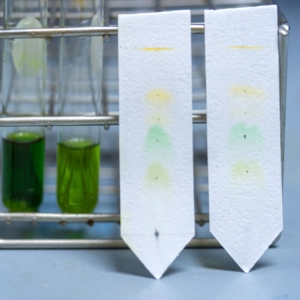
Chromatography means “graph of colors.” It separates the components of a mixture by passing them through a medium that will cause the components to move at different rates. There are several forms of chromatography, including paper chromatography, thin-layer chromatography, gas chromatography, and column chromatography. The type of mixture to be separated and the overall outcome for the separation will help determine the type of chromatography that will work best. For example, gas chromatography is preferred if you separate a mixture of gases to identify the components. On the other hand, column chromatography will work best if you separate a mixture of liquids. An example of a paper chromatogram is shown in Figure 1.0.
Chromatography has a mobile phase and a stationary phase. The mobile phase moves. It is what carries the mixture being separated. How the mobile phase and the mixture interact will determine how well the components separate. The stationary phase doesn’t move. It is what the mobile phase and the mixture travel across.
In this experiment, we are conducting paper chromatography. The mobile phase will travel up the chromatography paper (the stationary phase) and separate the pigments in the dyes we are testing. Intermolecular forces will determine the rate at which the dyes move in the mobile phase. If a pigment has a similar polarity to the mobile phase, it will move further up the stationary phase. If a pigment doesn’t have the same polarity as the mobile phase, it won’t move as far.
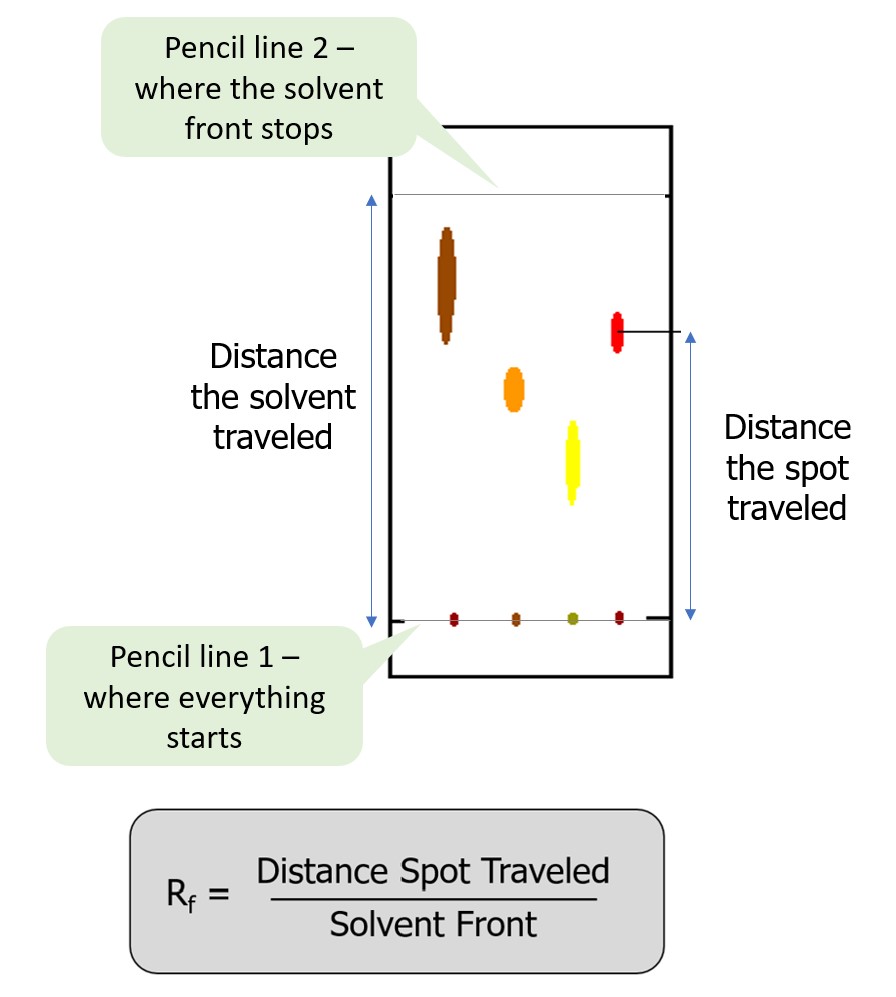
We will measure the distance the mobile phase traveled up the paper at the end of the experiment or the solvent front. The solvent front is the measurement from where the dots started (marked with a pencil line) to the farthest point the solvent traveled up the paper. We will also measure how far each pigment travels up the stationary phase. You may see several spots appear for each of the dyes tested. These are the different pigments in each dye sample. You will need to measure the distance each of these separated pigments traveled. For instance, if you see two spots appear on your paper for a blue dye, then you want to measure how far both of these spots traveled. To do this, measure from where the dots started (marked with a pencil line) to the approximate midpoint of the spot. Sometimes this is not clear. Do your best to estimate the midpoint. The solvent front and distance each pigment traveled allow us to calculate the Retention Factor (Rf).
The Retention Factor is a relative measurement of how far each pigment moved up the stationary phase. The closer the Retention Factor to 0, the less the pigment moved, and the less soluble the pigment is in the mobile phase. The closer the Retention Factor to 1, the farther it moved and the more soluble the pigment is in the mobile phase. The Retention Factor should never exceed one because this means the pigment moved farther than the solvent front, which is not possible.
Figure 2.0 provides an example of these measurements and the formula for calculating the Retention Factor. Figure 3.0 demonstrates how to measure and calculate the Rf.
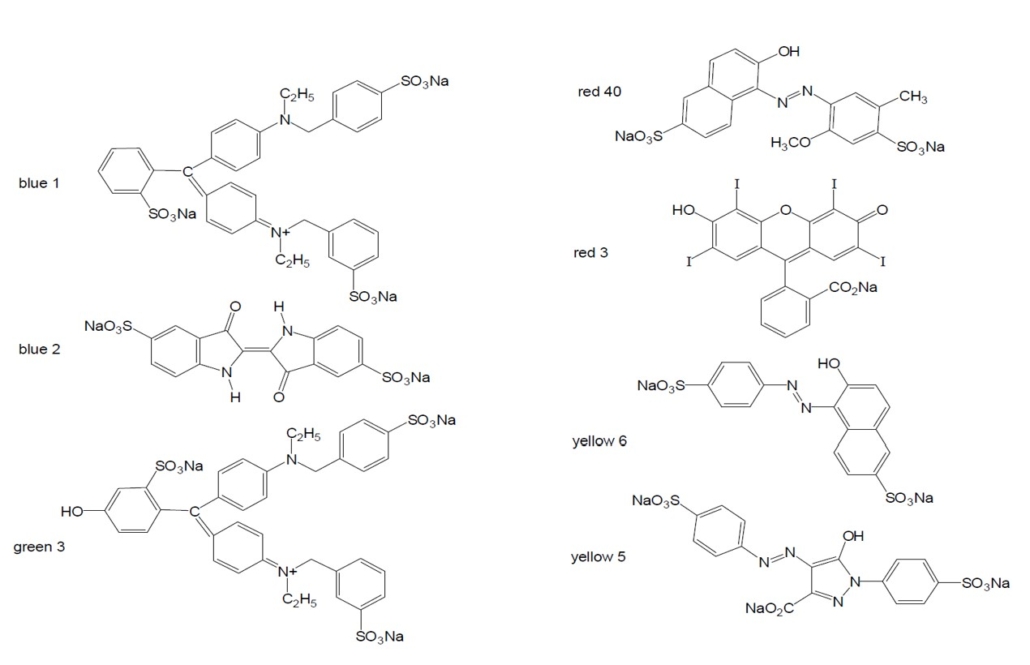
The dyes we are testing in this experiment are used in food. The structures for the seven dyes approved for use in food by the Food and Drug Administration (FDA) are illustrated in Figure 4.0 below. We will then test 3 flavors of Kool-Aid and determine which of the seven dyes are present based on the Retention Factors calculated.
Figure 1.0 – Example of a paper chromatogram. (above)
Figure 2.0 – How to calculate Retention Factor (Rf). (below)
Figure 3.0 – Video demonstrating how to calculate the Retention Factor.
Figure 4.0 – Structures of the seven dyes with FDA approval for use in food. (Austin)
Creating a Data Table
You will need to create a data table for this lab. I recommend you set it up before coming to the lab as it will make your experiment go easier and keep your data neatly organized. If you prefer to create your data table as you complete your experiment, you are welcome to do that was well, remember to keep it neat and organized so others can clearly and easily read and follow your data.
When designing your data table, consider what you measure in the lab. You need to create space to record that data in your table. We will also be calculating Rf in the lab. Create a column in your table that allows you to include this calculated data in with the other data you will collect in the lab. Remember that each pigment you spot on the chromatography paper could create up to 3 spots that you will need to measure at the end of your experiment. Plan accordingly to allow space for all of this possible data.
Figure 5.0 guides you through how to design a data table.
Figure 5.0 – How to design a data table for collecting experimental data.
Safety Information
FD&C dyes can stain your clothes and skin. I do not recommend wearing your favorite clothing for this experiment.
Nitrile gloves and chemical aprons are available for student use in the chemistry lab. Wear your goggles throughout this lab.
Pre-Lab Lecture Video
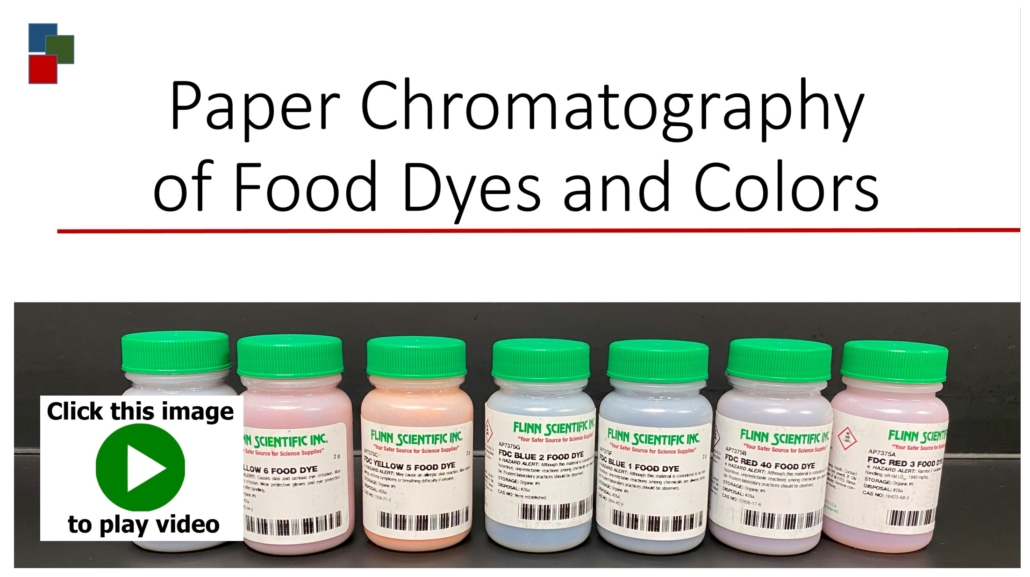
Click on the image to the right to watch the pre-lab lecture video for this experiment. The information in this video will help you come to the lab prepared to complete this experiment.
Figure 6.0 – Pre-lab lecture video. Click on the image above to view the video. It will open in a new window.
Below is the link to the journal article discussed in the prelab lecture video and its APA 7th Edition citation.
A Global Perspective on the History, Use, and Identification of Synthetic Food Dyes
Citation in APA 7th Edition
Sharma, McKone, H. T., & Markow, P. G. (2011). A Global Perspective on the History, Use, and Identification of Synthetic Food Dyes. Journal of Chemical Education, 88(1), 24–28. https://doi.org/10.1021/ed100545v
Pre Lab Assignment
The prelab assignment is due at the start of the lab period. You cannot conduct the experiment unless you have completed the prelab assignment.
Click HERE to open the prelab assignment. You will need to print this assignment before completing it.
Be sure to conduct all measurements in metric units and measure one place beyond what you are certain.
Experimental Procedure
Experimental Supplies
Chromatography paper
0.10% NaCl solution
FD&C Dyes
3 Kool-Aid™ mixes
600mL Beaker
Pencil
Capillary Tubes or toothpicks
Watch glass
Metric Ruler
Paper Towels
PART A: Equipment and Set-Up
- Obtain one piece of chromatography paper.
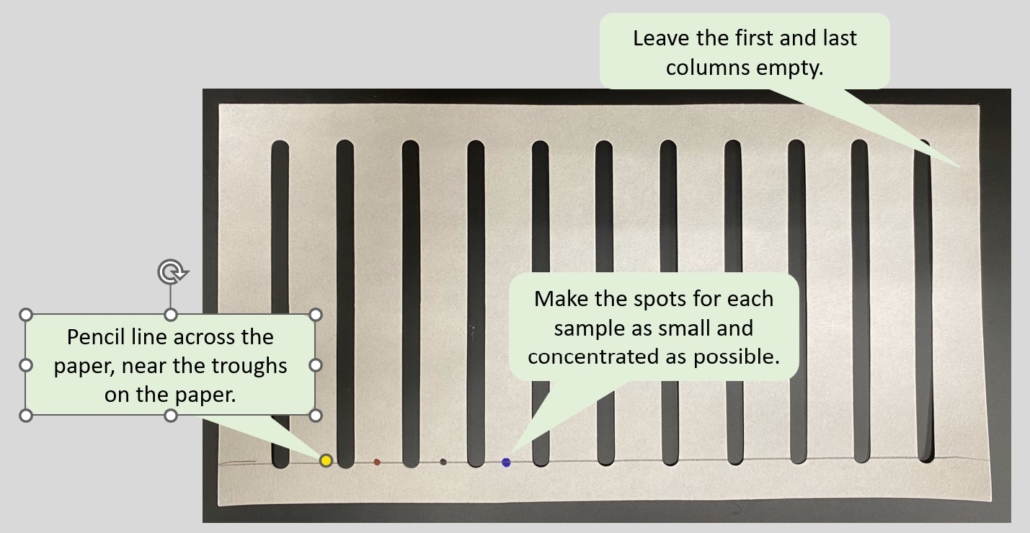
- Using a pencil, draw an origin line along the bottom of the paper, just below the breaks in the paper. (Figure 6.0)
- Starting on the second column of the paper, using a pencil, indicate the names of FD&C dyes: B1 B2 Y5 Y6 R3 R40 G3.
- Label the origin line three commercial food colors and three Kool-Aid™ mixes.
NOTE: The chromatography paper’s first or last column should be left blank.
- In a clean 600mL beaker, place 25 mL of 0.10% NaCl solution cover with a watch glass.
Figure 6.0 – Example of how to setup/spot the chromatography paper.
PART B: Spotting the Chromatography Paper
- Place the open end of a capillary tube in each solution to draw a little of the solution into the tube. Next, carefully spot the paper by placing the tip of the tube to the paper on the origin line. Keep the spot as small as possible. Allow the spot to dry. Repeat this process at least three to five times, placing each dot on top of the last dot. Figure 6.0 provides an example of spotting on the origin line.
- Repeat the step above for each of the other six colors, using a new capillary tube for each dye.
- Spot the Kool-Aid™ solutions using the same process outlined in the first step of part B.
- After the spots are dry, slowly and carefully roll the paper into a cylinder and staple edges together, allowing the first and last columns of the paper to overlap.
NOTE: Be sure that the top and bottom edges of the chromatography paper overlas perfectly so your paper will stand properly in the beaker.
PART C: Developing the Chromatogram
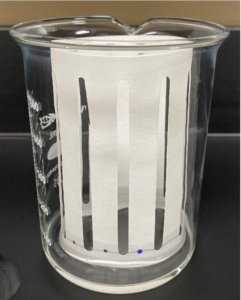
- Remove the watch glass and place the paper cylinder into the beaker. (Figure 7.0)
NOTE: The Origin Line must be at the bottom, with the spots above the mobile phase. The mobile phase cannot touch the dots. Likewise, the paper cannot touch the sides of the beaker.
- Recover with the watch glass.
- Remove the paper from the beaker when the solvent front is 2 cm from the top of the paper. Then, carefully open it and lay it flat on a paper towel.
- With a pencil, mark the top point on the chromatogram where the mobile phase reached.
- Allow the chromatography paper to dry completely before taking any measurements.
Figure 7.0: The chromatogram after it’s placed in the beaker with the mobile phase.
PART D: Data & Calculations
- Measure and record the distances traveled by the solvent front from the origin line. Record this information in your data table.
- Measure and record the distance traveled by all FD&C dyes from the origin line. Record this information in your data table.
- Record the flavors of Kool-Aid™ samples and describe the colors of observed spots in your data table. Record this information in your data table.
- Calculate the Retention Factor for all spots. Include these calculations in your lab notebook and record the information in your data table.
- Identify the FD&C food dyes in the Kool Aid™ samples. Record this information in your lab notebook.
Waste Disposal
- Place the chromatography paper in the trash.
- Dispose of the sodium chloride solution down the drain.
- Place the paper towels in the trash.
- Wash any other equipment used with soap and DI water (the final rinse is with DI water) before putting it away.
Post Lab Assignment
Once you have completed this experiment and recorded all of your data in your laboratory notebook:
- Write the discussion and conclusions sections for the lab. The questions in the post-lab assignment will help you process the data from this lab. Include all of the calculations from the post-lab assignment in your lab manual.
- Complete the post-lab assignment and submit it to your instructor.
Paper Chromatography of Food Dyes and Colors Post-Lab Questions (16 points)
Answer the following questions using the information you gathered during today’s lab. This is due at the start of the next lab period.
- Calculate the Rf factors of all of your spots. List the value for each spot below. (6 points)
- Based on these values, which of the food dyes are polar/nonpolar? Why? (5 points)
- Why is it important to not let the spots touch the mobile phase when you place it in the beaker? What error will this introduce into your experiment? (2 points)
- According to your results, what dyes are used in each Kool-Aid flavor? How do your results compare to the known dyes in the Kool-Aid (obtained from your instructor)? (2 points)
Lab Report
You must write a lab report on the experiment and your results. Please see the Guide for Writing a Lab Report. The due date for this assignment is noted on the semester schedule.
Below are some experiment-specific information you will need to include in your report:
- A data table outlining your results.
- The Retention Factor for each spot that appeared after your chromatogram was developed. Show one sample calculation for these values.
- Use A Global Perspective on the History, Use, and Identification of Synthetic Food Dyes article in your introduction to discuss the use of food dyes in our food.
- Discuss how solubility, polarity, and intermolecular forces relate to this concept and your findings.
- Identify the dyes present in the Kool Aid™ samples tested.
- We are not reporting class data in this report, so there is no need to include mean, median, range, and standard deviation.
- You do not need to include any graphs in this report.
A rubric for this formal lab report can be found on Brightspace if you go to Assignment → Rubrics → Paper Chromatography Lab Report Rubric.
References
Austin Peay State Univerity. (2015). Retrieved from http://www.apsu.edu/files/chemistry/Paper_Chromotography_of_Food_Dyes_and_Colors_RF8.pdf
Markow. (1988). The ideal solvent for paper chromatography of food dyes. Journal of Chemical Education, 65(10), 899–. https://doi.org/10.1021/ed065p899
Ochemistree. (2013, June 15). Calculating Rf Values [Video]. YouTube. https://youtu.be/VtkwBLTd0rA
ScienceGonnaGetYou. (2015, October 14). How to Make a Data Table [Video]. YouTube. https://youtu.be/vatJYQEV-qA
Sharma, McKone, H. T., & Markow, P. G. (2011). A Global Perspective on the History, Use, and Identification of Synthetic Food Dyes. Journal of Chemical Education, 88(1), 24–28. https://doi.org/10.1021/ed100545v
This page was published on January 3, 2024 and last updated on January 28, 2025.
©Catherine Haslag 2025. All Rights Reserved.
